How cells grow
Cells in a culture grow every day
We want to know the number of cells every day: \(\text{ncell(t)}\)
Here \(t\) is the time in days.
We start with an initial number of cells, that we call \(\text{initial}\)
Each day, the number of cells increases by a factor
\(\text{rate}\)
\[\text{ncell(t)} = \text{initial} \cdot
\text{rate}^{t}\]
How can we model it?
What is a logarithm?
We need very little math: arithmetic, algebra, and logarithms
Just remember that if \(x=p^m\) then
\[\log_p(x) = m\] For example \[\log_{10}(10000) = 4\]
We can change the base
If we use another base, for example \(q\), then \[\log_q(x) = \log_p(x) /\log_p(q)\] For
example \[\begin{aligned}
\log_2(10000) &= \log_{10}(10000)/\log_{10}(2)\\
\log_2(10000) &= 4/\log_{10}(2)\\
13.28771 &= 4 / 0.30103
\end{aligned}\]
We can choose the best base
So if we use different bases, there is only a scale factor
The “easiest” one is natural logarithm
If \[x=\exp(m)\] then \[\log(x)=m\]
Other things about logarithms
They only work with positive numbers. Not with 0
If \(x=p\cdot q\) then \[\log(x)=\log(p)+\log(q)\]
If \(x=a^m\) then \[\log(x)=m\log(a)\]
Linear models can be used in three cases
Basic linear model \[y=A+B\cdot x\]
Exponential change (Initial value and growth Rate) \[y=I\cdot R^x\] Power law (Constant and
Exponent) \[y=C\cdot x^E\]
In other words
Basic linear model \[y=A+B\cdot x\]
Exponential: if \(y=I\cdot R^x\) then
\[\log(y)=\log(I)+\log(R)\cdot x\]
Power of \(x\): if \(y=C\cdot x^E\) then \[\log(y)=\log(C)+E\cdot\log(x)\]
Which one to use?
The easiest way to decide is to
- draw several plots, placing log() in different
places,
- see which one seems more like a straight line
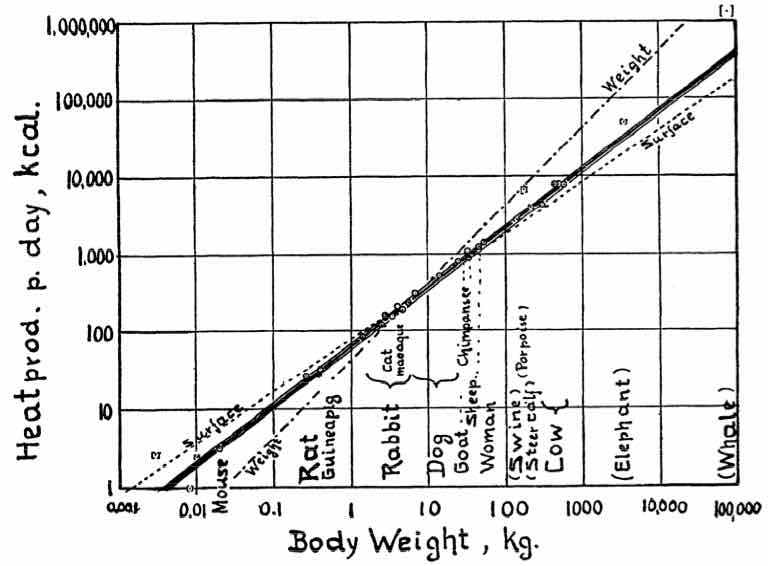
For example, let’s analyze data from Kleiber’s Law
https://www.dry-lab.org/static/kleiber1947.txt
Exercise: Make all plots. Which plot seems more
“straight”?
Which plot seems more “straight”?
The plot that seems more straight line is the log–log plot
Therefore we need a log–log model.
\[\log(\text{kcal})=β_0 + β_1 \cdot
\log(\text{kg})\]
What is the interpretation of these coefficients?
If \(\log(\text{kcal})=4.21 + 0.756\cdot
\log(\text{kg})\) then \[\text{kcal}=\exp(4.21) \cdot \text{kg}^{0.756}
=67.1 \cdot \text{kg}^{0.756}\]
Therefore:
- For a 1kg animal, the average energy consumption is \(\exp(4.21) = 67.1\) kcal
- The energy consumption increases at a rate of \(0.756\) kcal/kg.
This is Kleiber’s Law
“An animal’s metabolic rate scales
to the ¾ power of the
animal’s mass”.
Google it
Prediction: What is wrong here?
| Mouse |
0.021 |
3.6 |
1.285 |
| Rat |
0.282 |
28.1 |
3.249 |
| Guinea pig |
0.410 |
35.1 |
3.532 |
| Rabbit |
2.980 |
167.0 |
5.031 |
| Cat |
3.000 |
152.0 |
5.036 |
| Macaque |
4.200 |
207.0 |
5.291 |
| Dog |
6.600 |
288.0 |
5.632 |
| Goat |
36.0 |
800 |
6.915 |
| Chimpanzee |
38.0 |
1090 |
6.955 |
| Sheep ♂ |
46.4 |
1254 |
7.106 |
| Sheep ♀ |
46.8 |
1330 |
7.113 |
| Woman |
57.2 |
1368 |
7.265 |
| Cow |
300.0 |
4221 |
8.517 |
| Young cow |
482.0 |
7754 |
8.876 |
Undoing the logarithm
We want to predict the metabolic rate, depending on the weight
The independent variable is \(\text{kg}\), the dependent variable is
\(\text{kcal}\)
But our model uses only \(\log(\text{kg})\) and \(\log(\text{kcal})\)
So we have to undo the logarithm, using \(\exp()\)
Visually (log–log scale)
![]()
Visually (linear scale)
![]()
In the paper
![]()
Exponential growth in Science and
Technology
Moore’s Law
![]()
A idea from 1965, by George Moore (Intel)
The simple version of this law states that processor speeds will
double every two years
More specifically, “the number of transistors on a CPU would double
every two years”
Moore’s data and model
![]()
Intel says
![]()
Real data: Number of transistors v/s year
![]()
Semi–log scale: Number of transistors v/s year
![]()
Computers get faster and faster
![]()
Definition of FLOPS
A ‘flops’ is a floating point operation per second
In simple words, is the number of multiplications per second that a
computer can do
Same happens with DNA
Cost of sequencing human genome
![]()
Cost of sequencing human genome
Months since Sept 2000
![]()