Class 14: NGS Genome Assembly & Statistics
Bioinformatics
Andrés Aravena
January 15, 2021
Depth

Depth is a property of each genome position
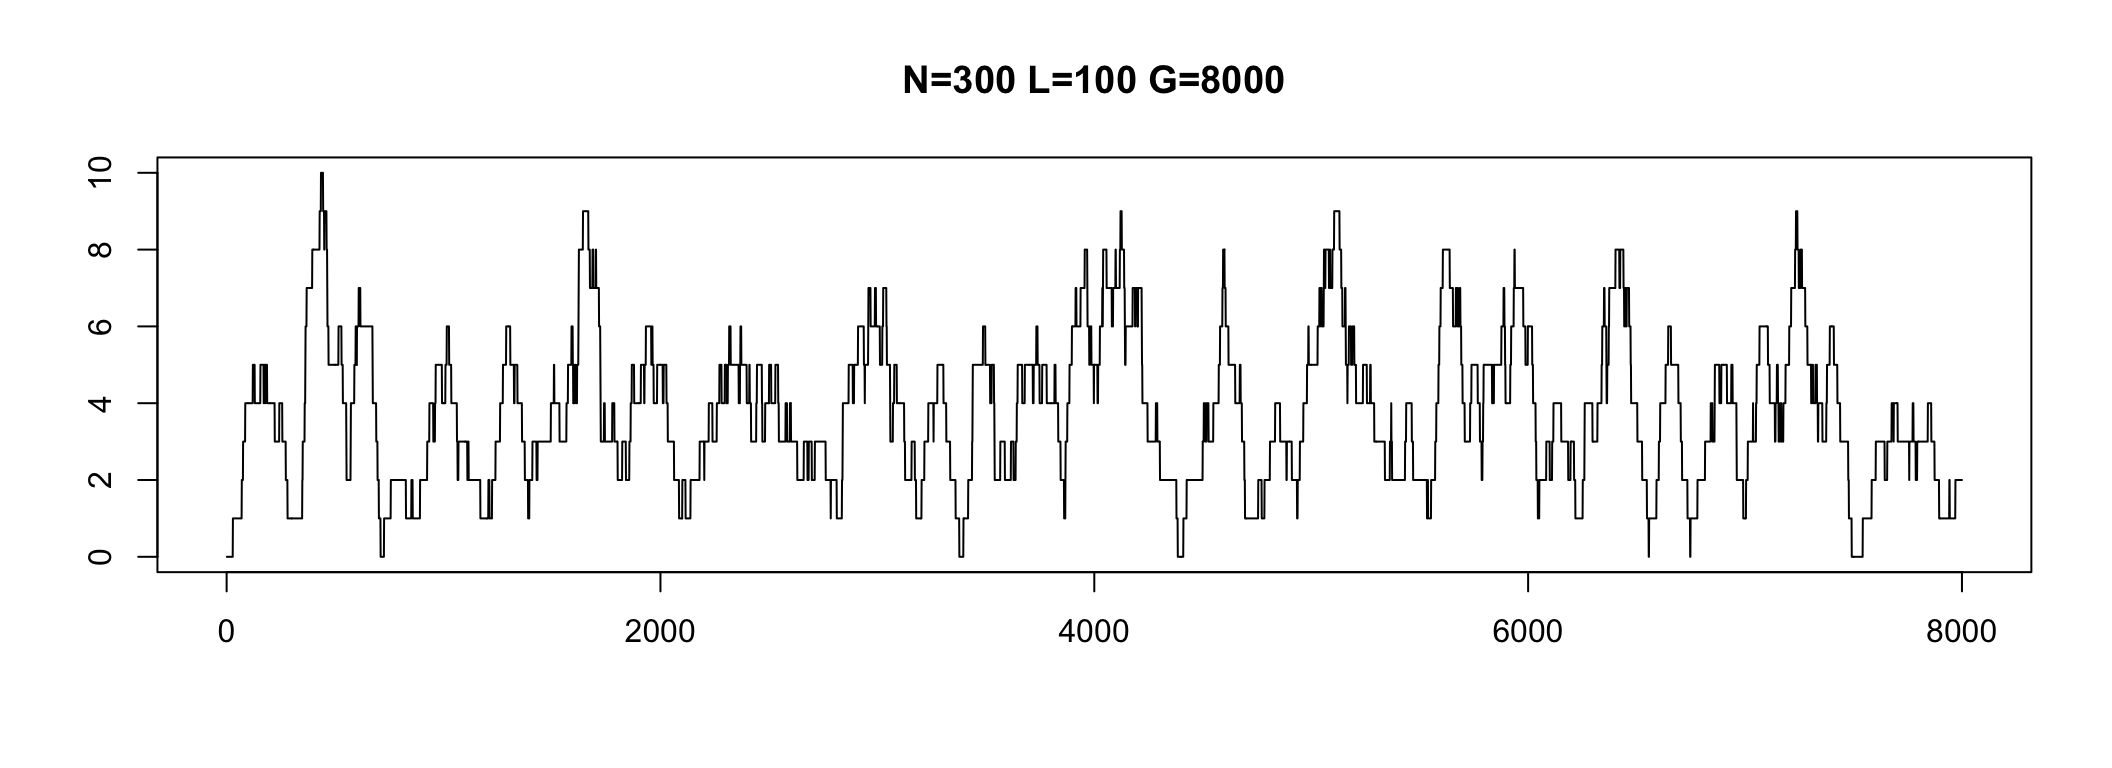
In practice, some genome parts have coverage 0
We do not see these regions
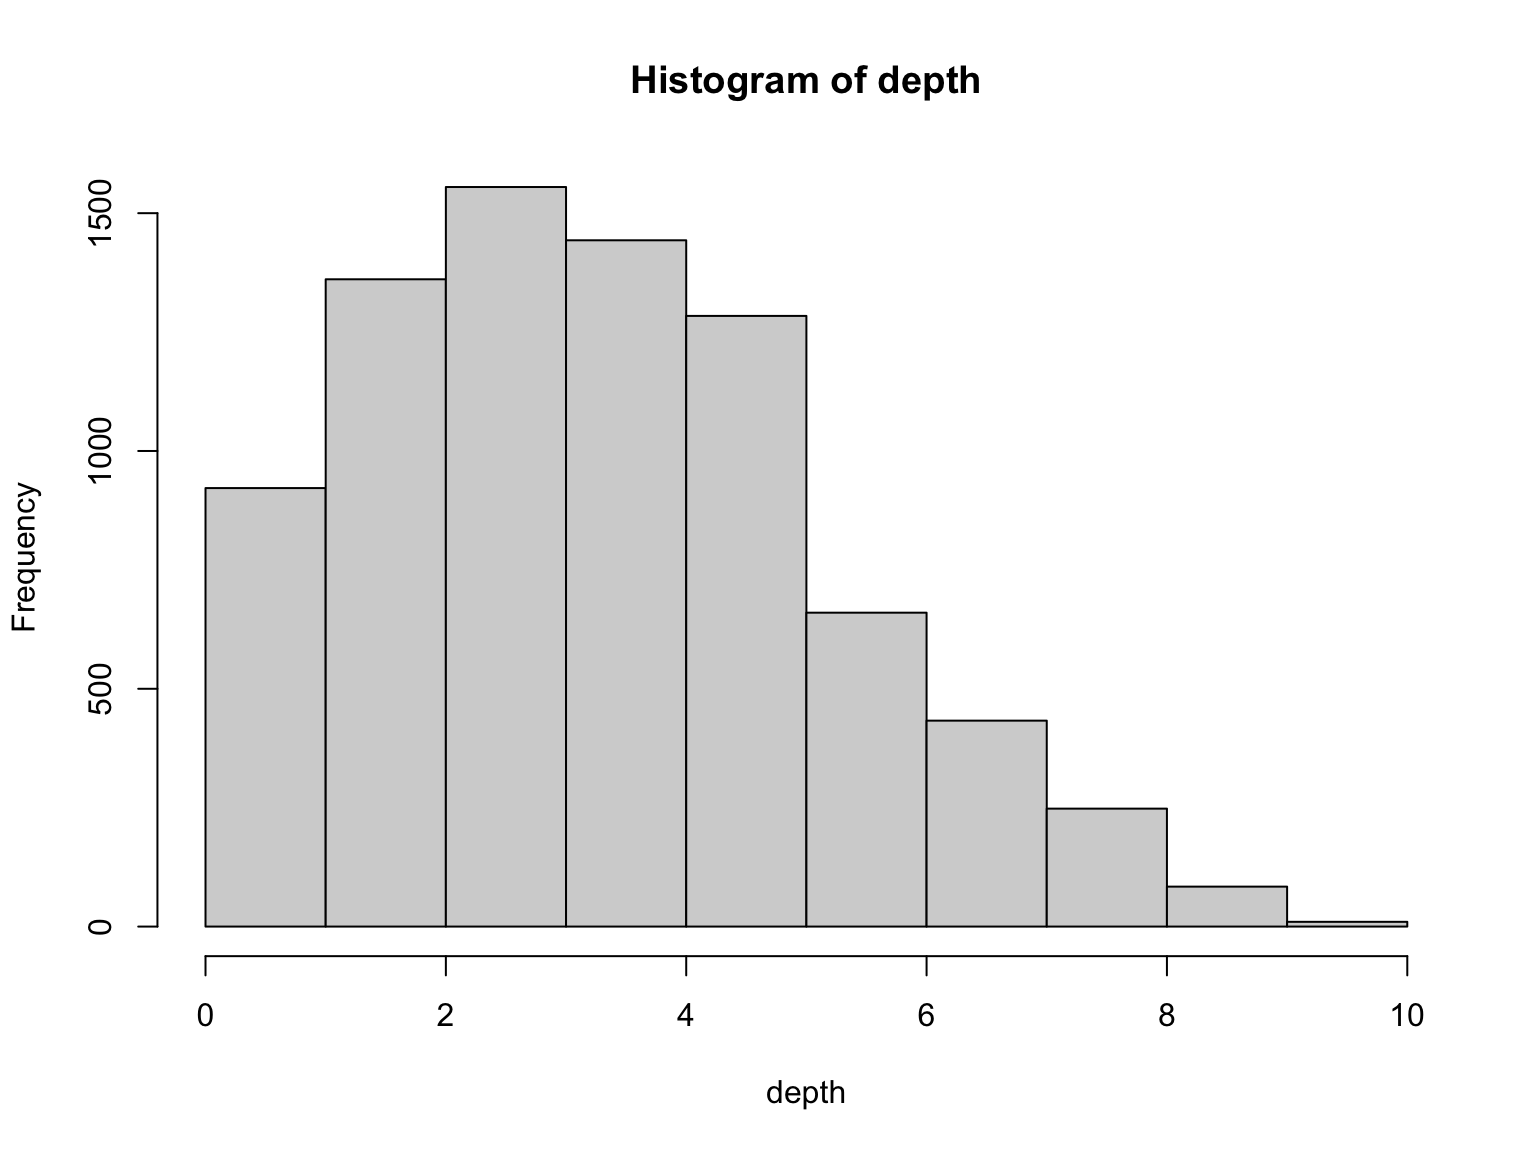
Depth varies in a range
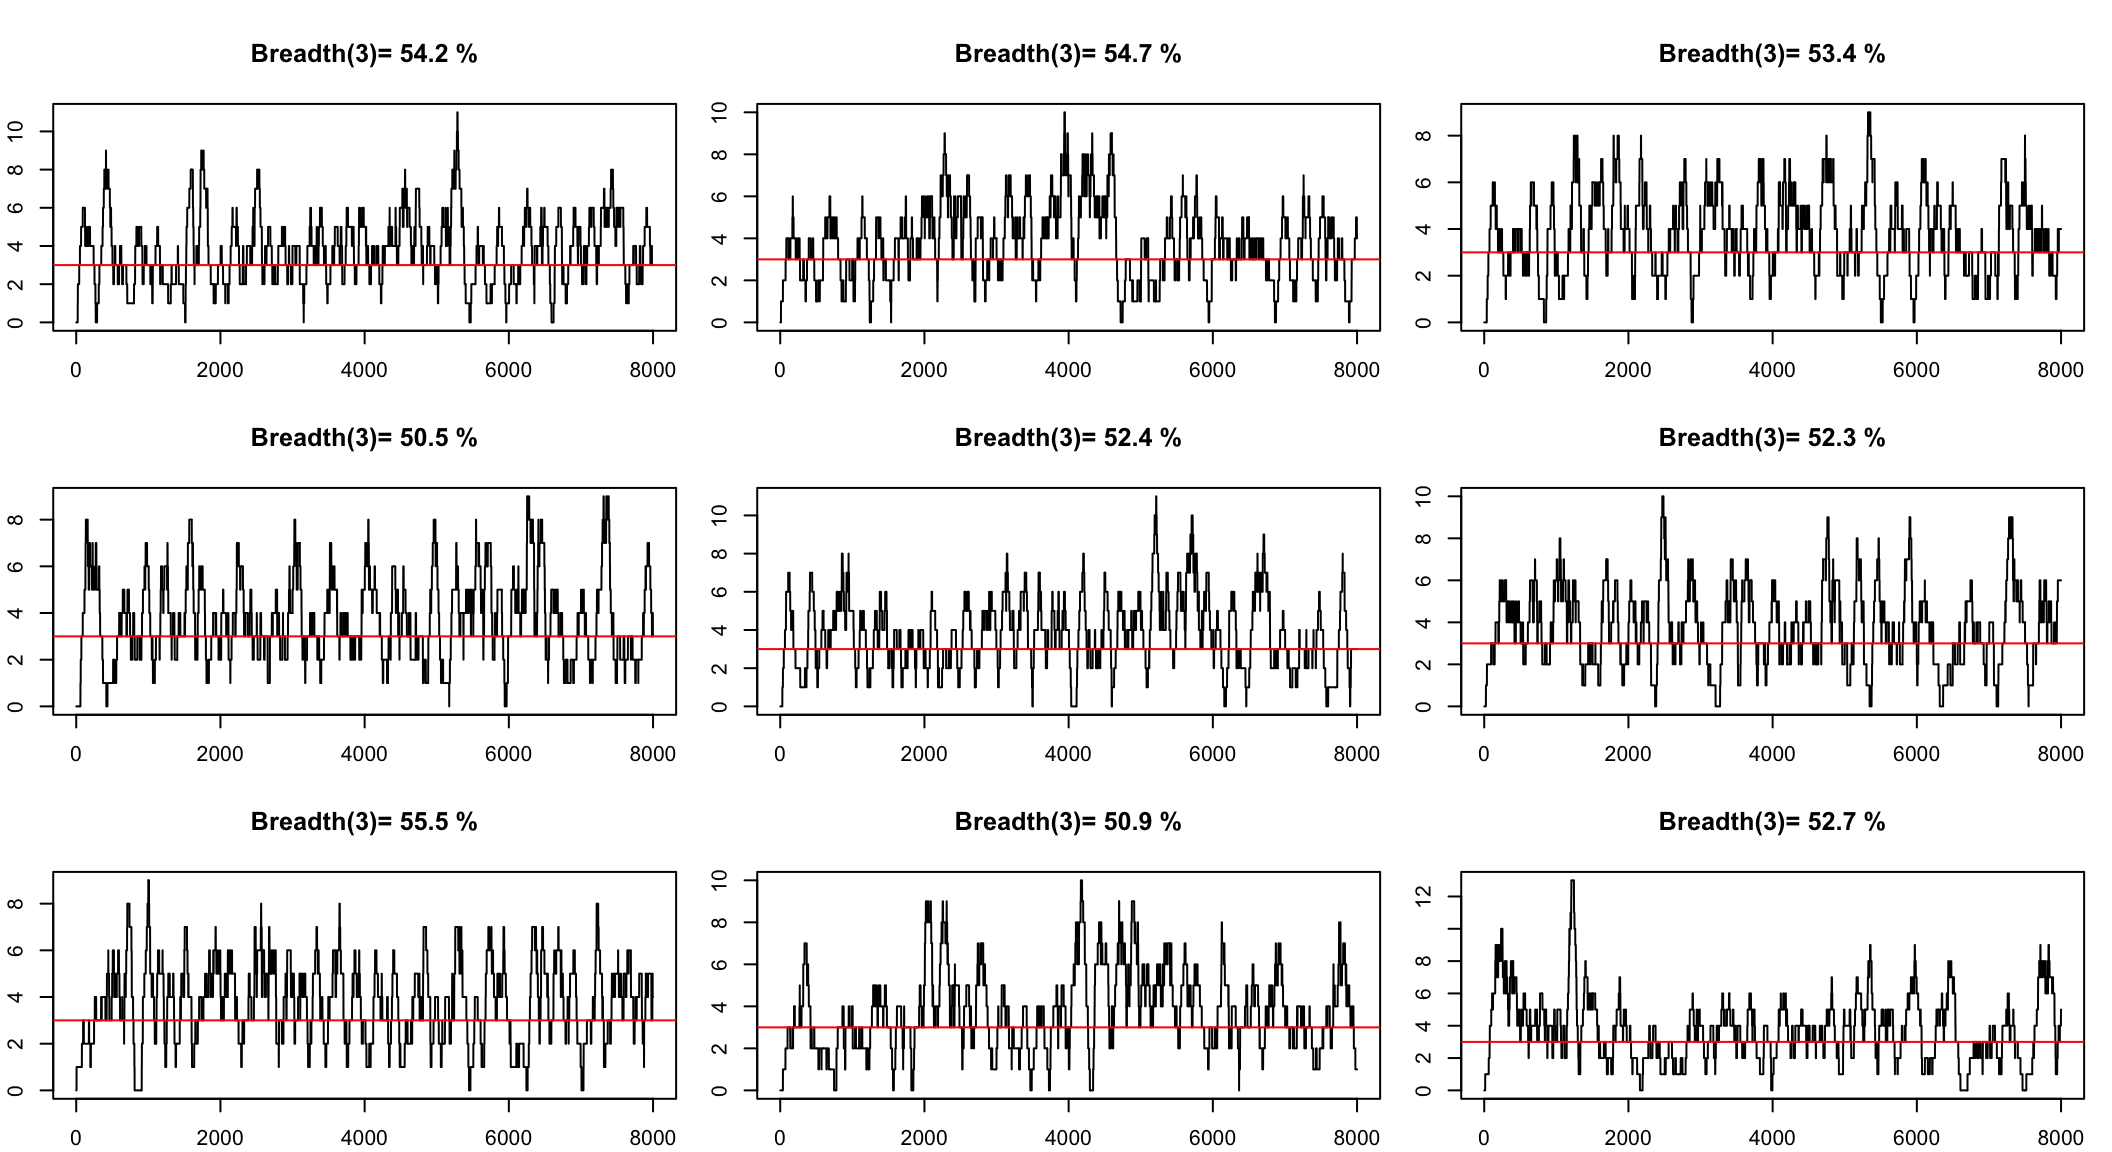
Coverage breadth for a minimum depth
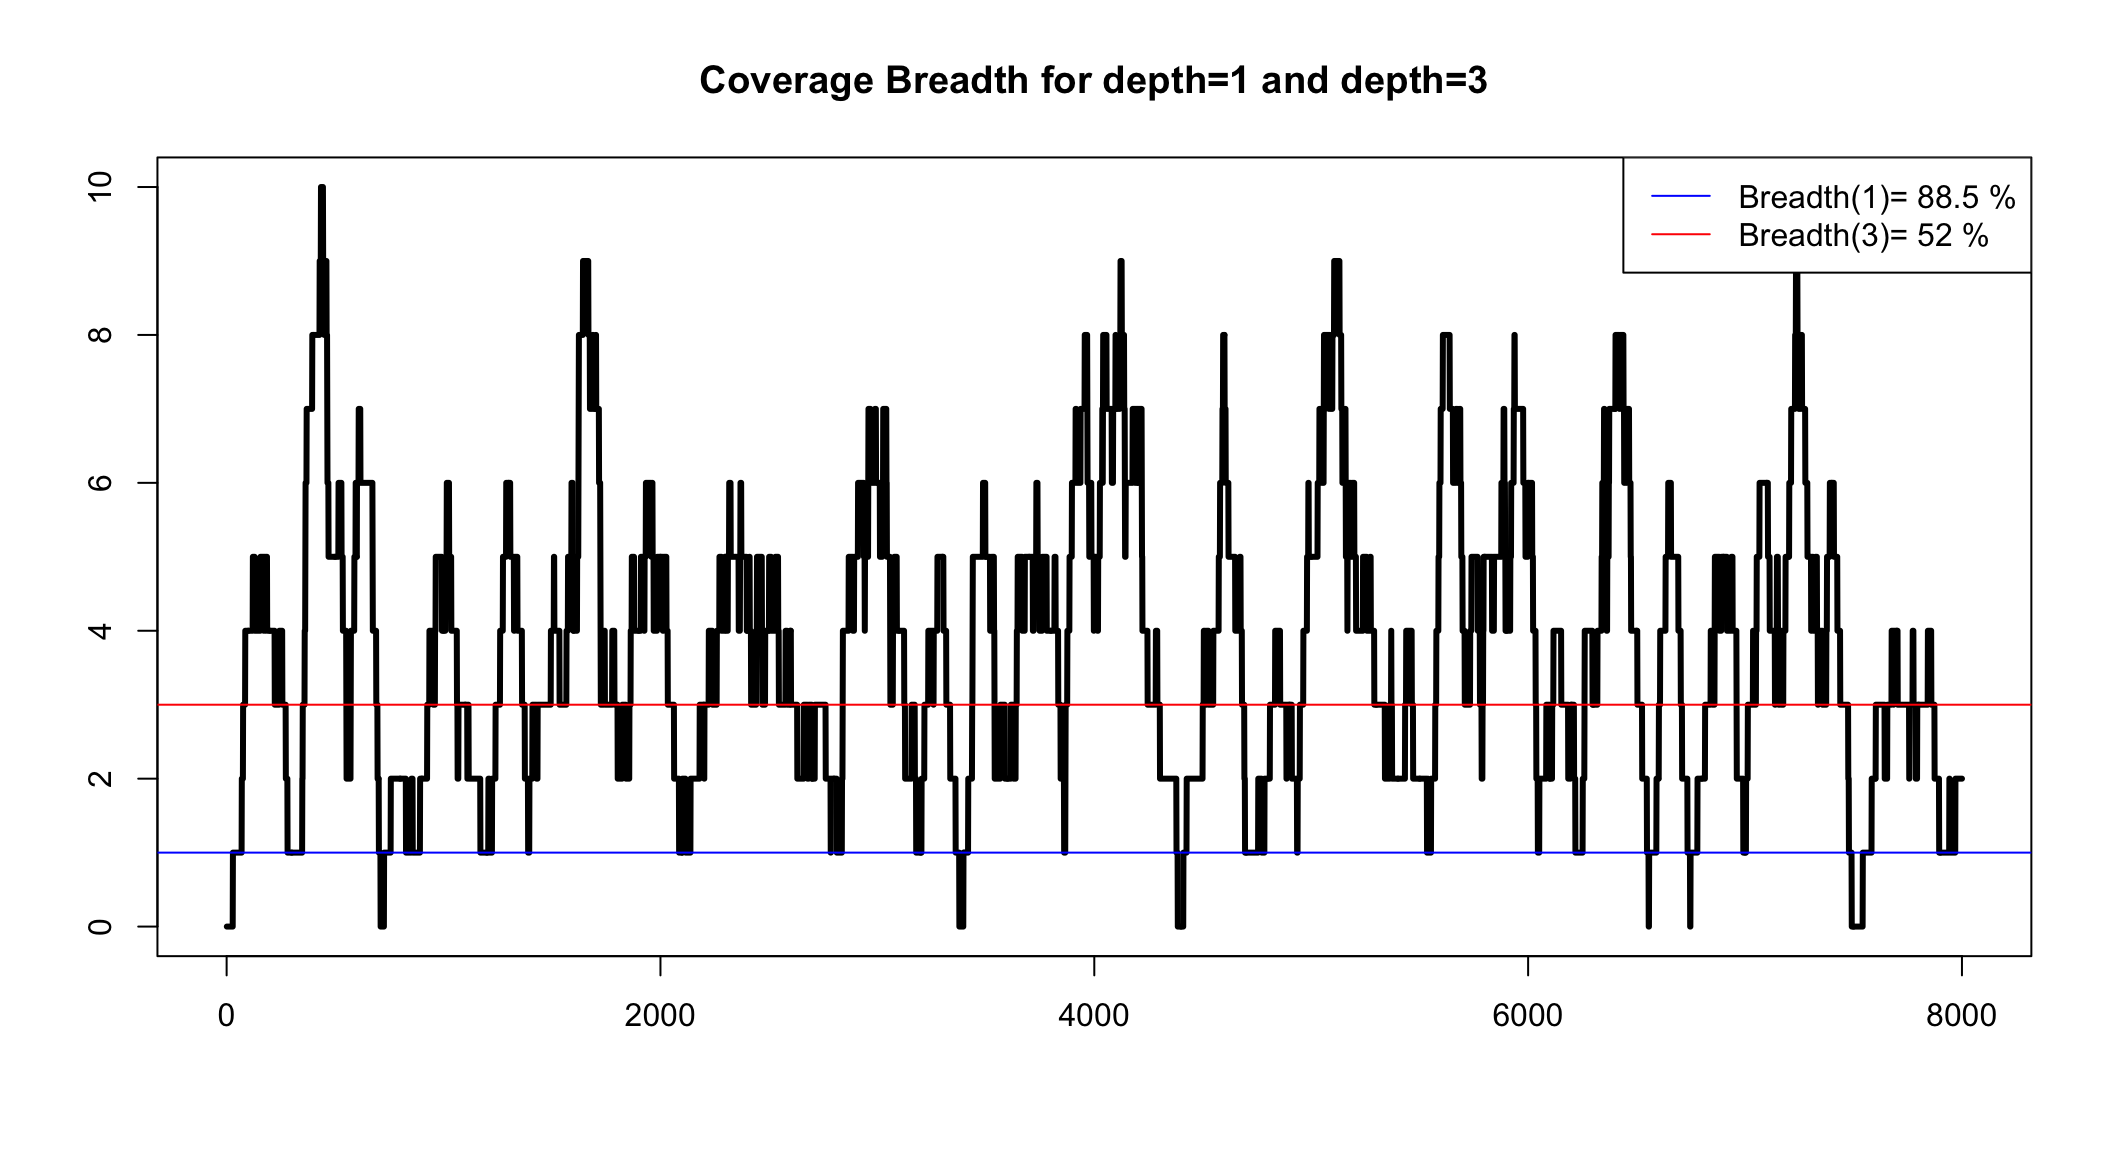
We can simulate to see the range
Num. contigs depends on 𝐺, 𝐿, 𝑁 and 𝑇
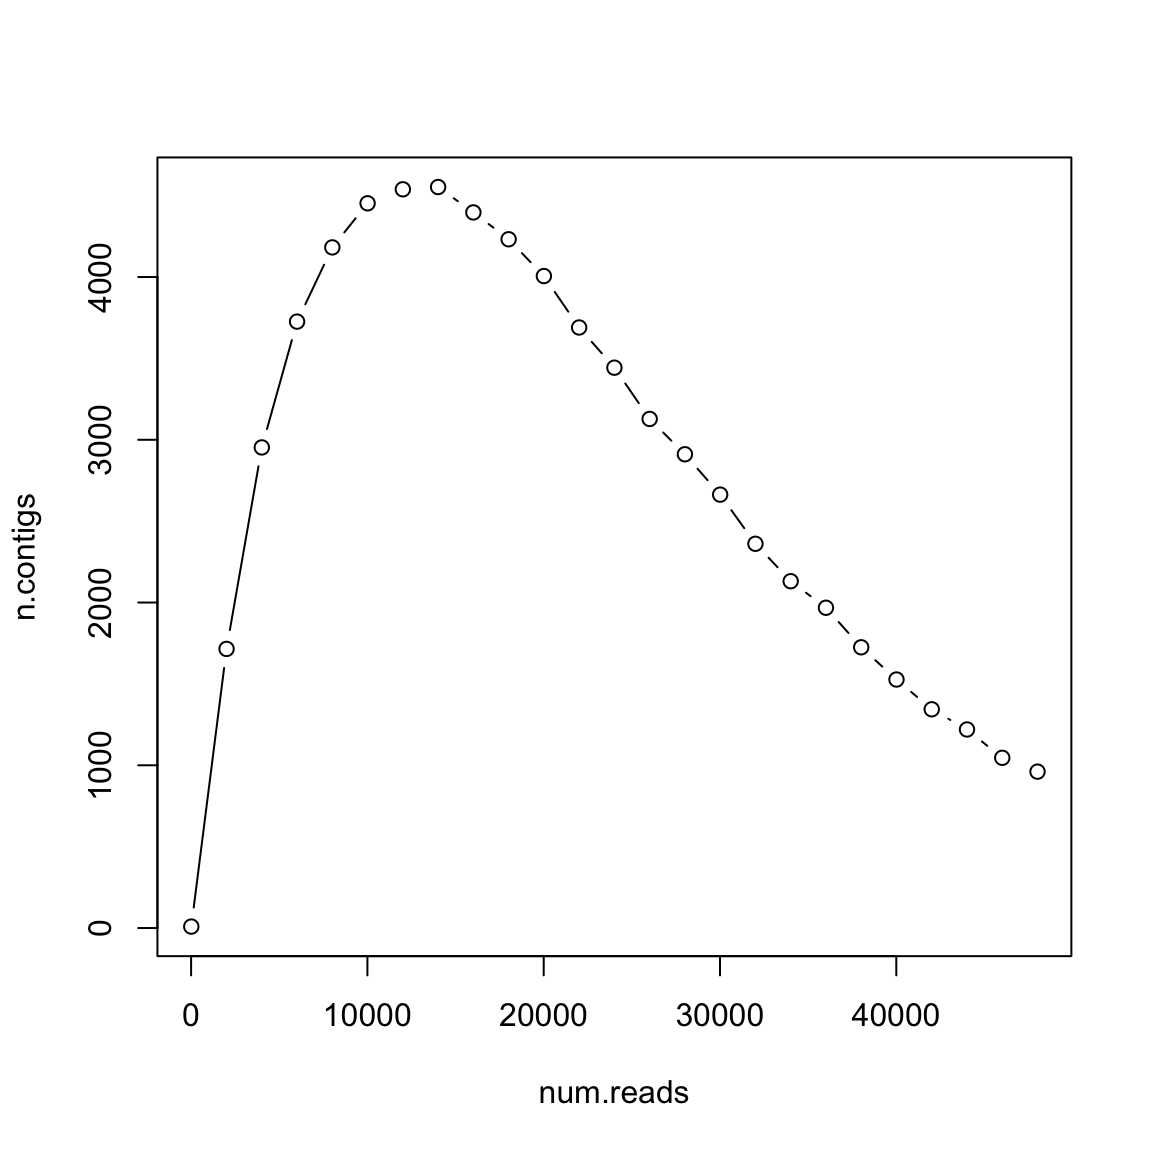
- 𝐿 =100
- 𝐺 =106
- 𝑇 =20
How many reads shall you pay?
What if reads are longer?
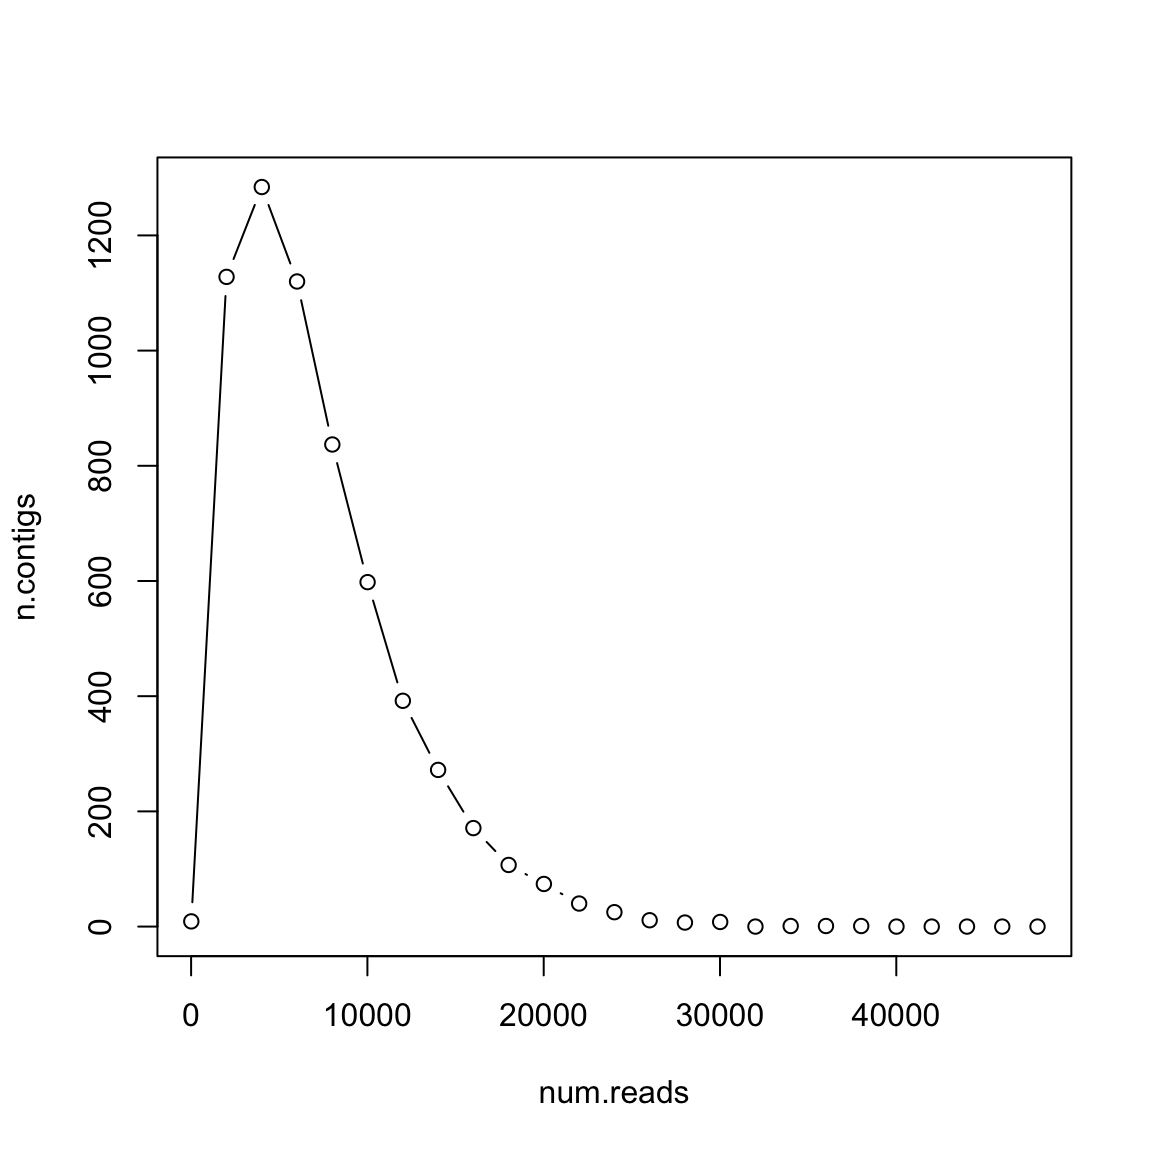
- 𝐿 =300
- 𝐺 =106
- 𝑇 =20
Longer reads are better
This is described in the paper
Lander ES, Waterman MS. Genomic mapping by fingerprinting random clones: a mathematical analysis. Genomics. 1988 Apr; 2(3):231-9. doi: 10.1016/0888-7543(88)90007-9. PMID: 3294162.

Contig length
With this simulation we can also calculate the length of each contig.
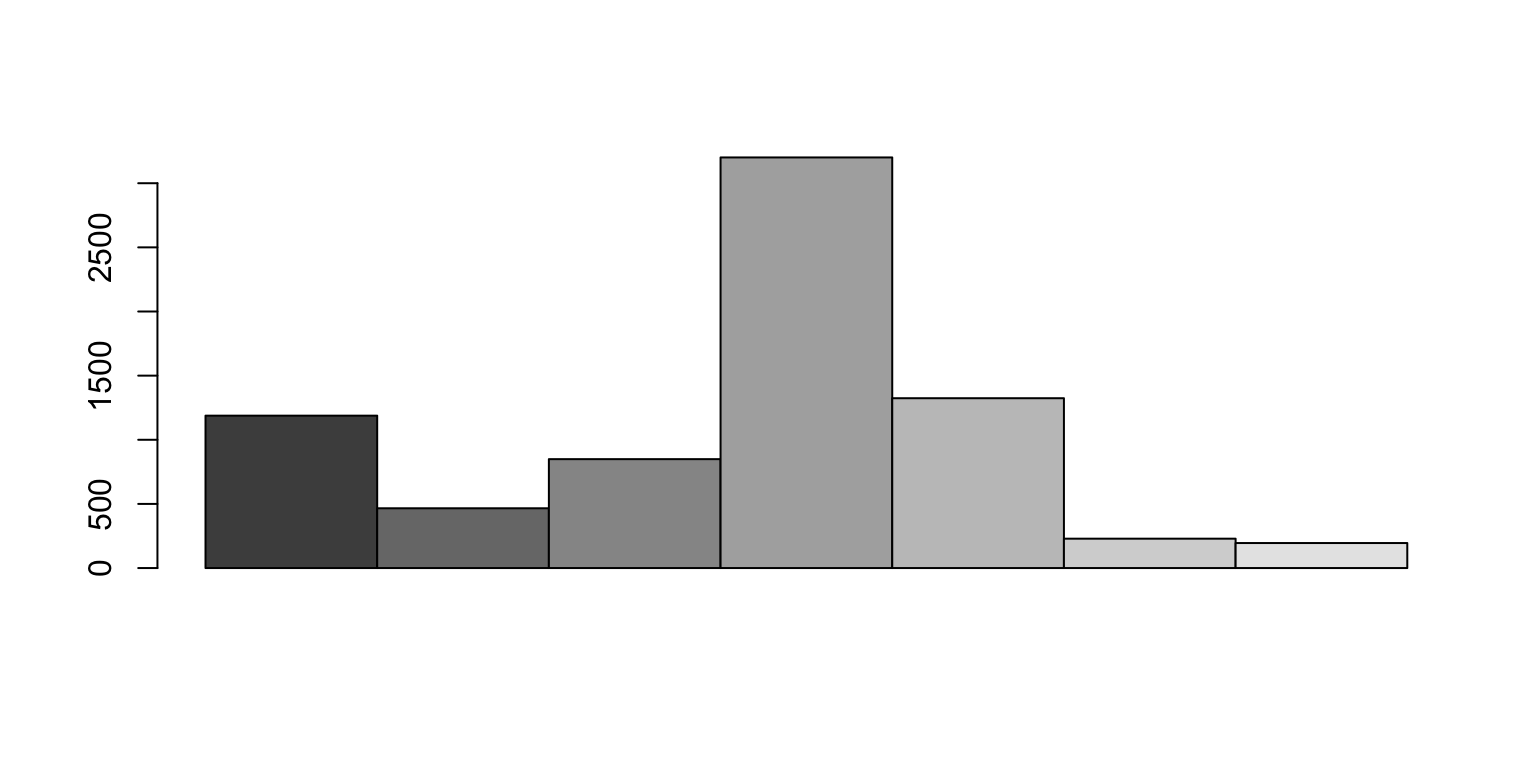
N50
Given a set of contigs, the N50 is defined as the sequence length of the shortest contig at 50% of the total genome length
We sort the contigs from largest to smallest
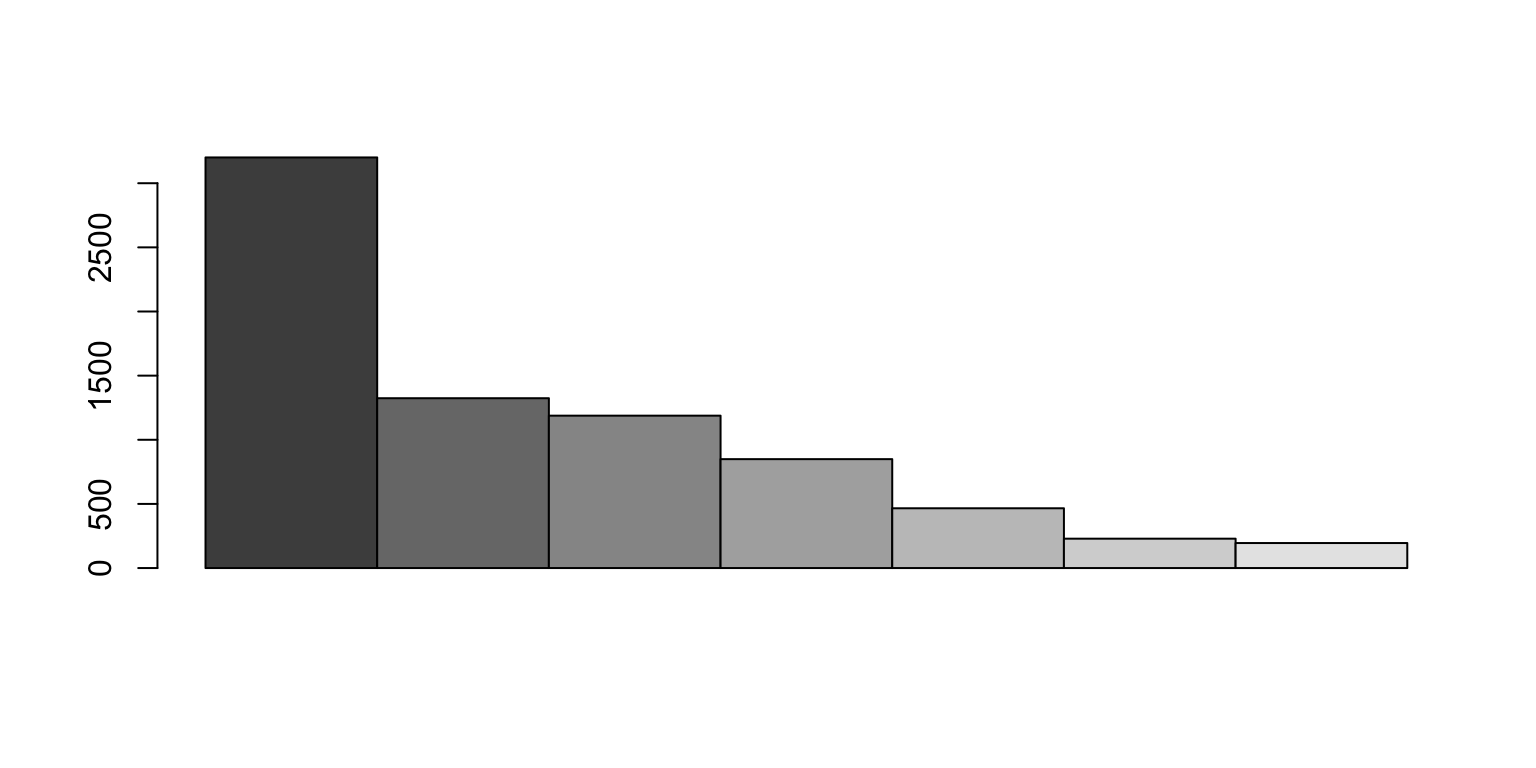
When do we get 50%?
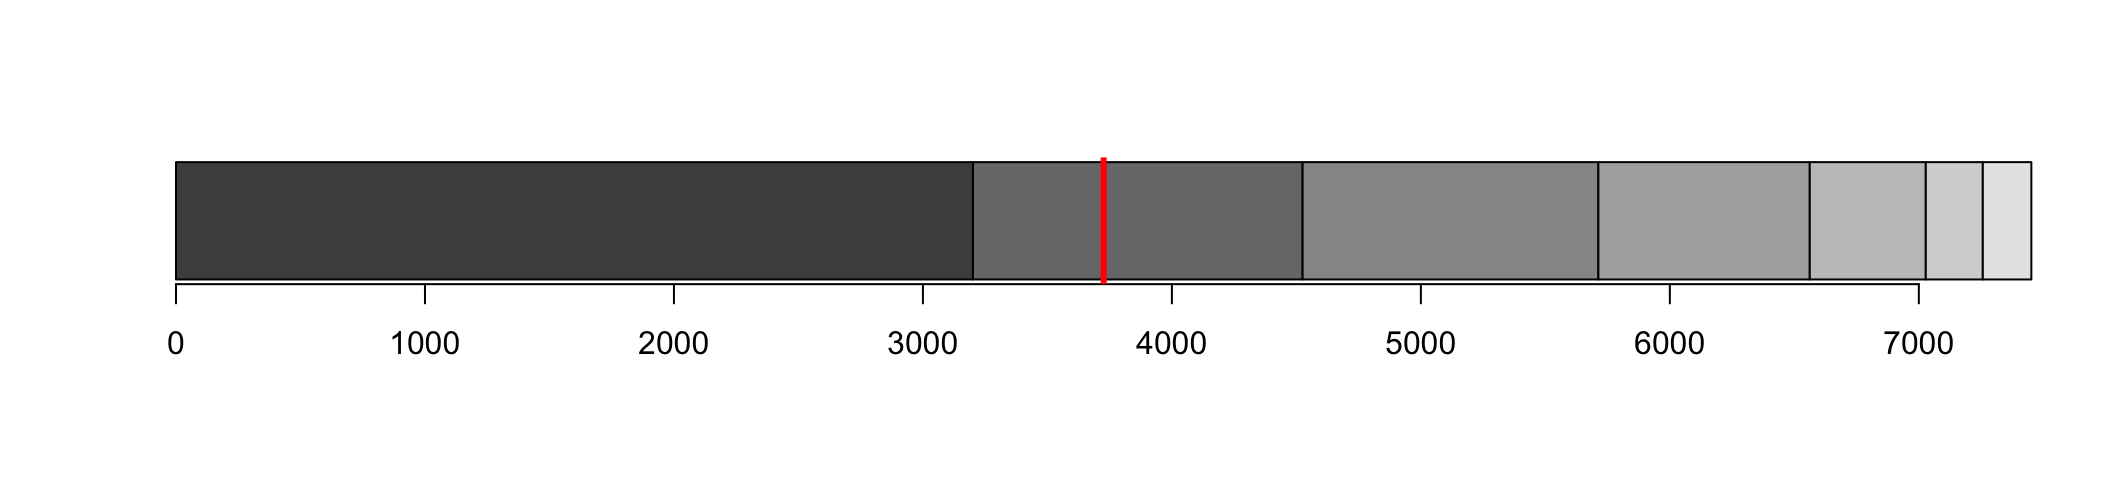
We identify which contig crosses the 50% line
N50 is the length of that contig
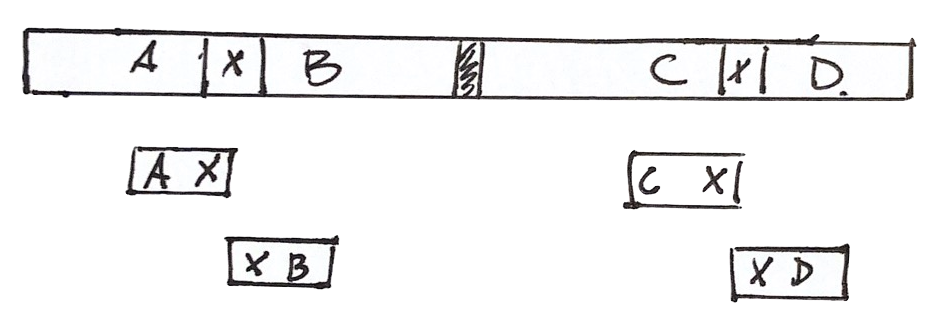
Each fragment has two reads
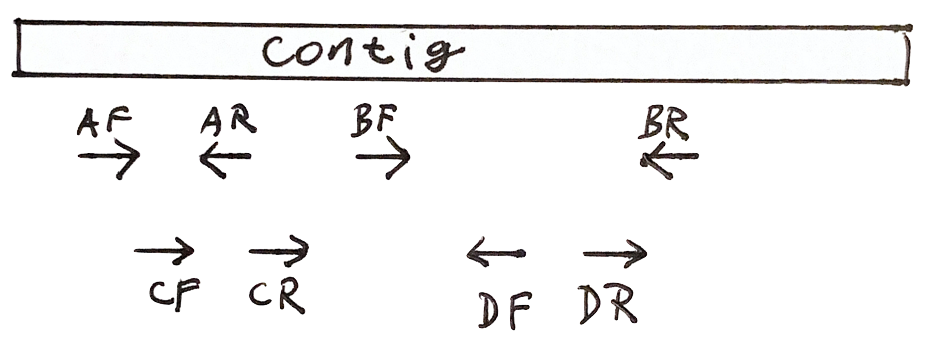
- Both reads should point to each other (AF, AR)
- If they point in the wrong direction, it is bad
- The distance between both reads should not be too large or too small
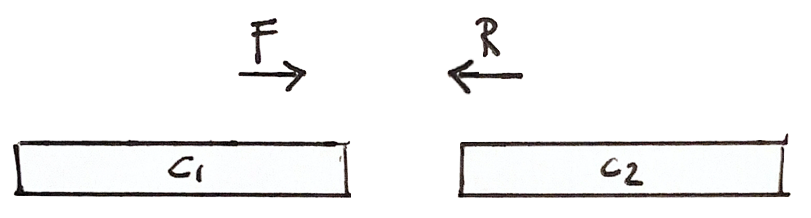
Scaffolding
If a fragment has one read in Contig 1 and the other in Contig 2, then we know that the contigs are close
Scaffolding
More shared fragments gives more confidence to the scaffold
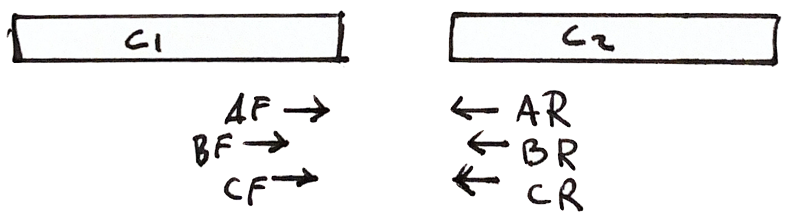
Scaffolding
Shared fragments allow us to find the relative orientation of contigs, and make a scaffold of contigs and gaps 
The problem of Repeats
The assembly can be wrong
Given the information we have, there are at least two solutions
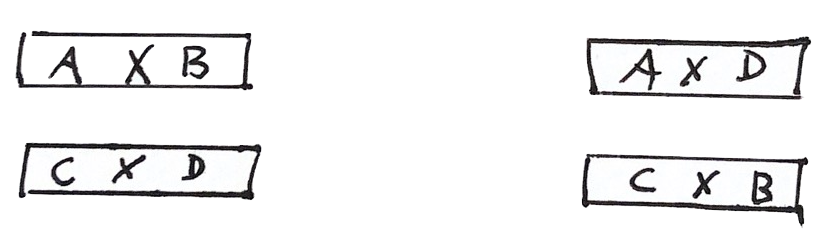
We cannot do better with the available information
We need more information
To decide the correct one, we need more information
For example, longer reads containing the repeat and its context

Or read pairs from larger fragments, so each read is outside the repeat
We get an honest assembly
This approach does not solve the repeats
Instead, it shows the repeats clearly
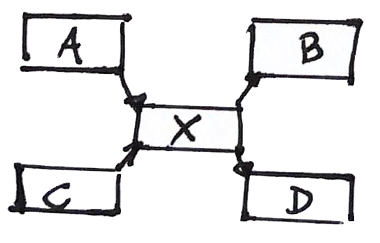
This way we know what are the issues, and we can design an experiment (PCR?) to solve them
Repeats result in a funny graph
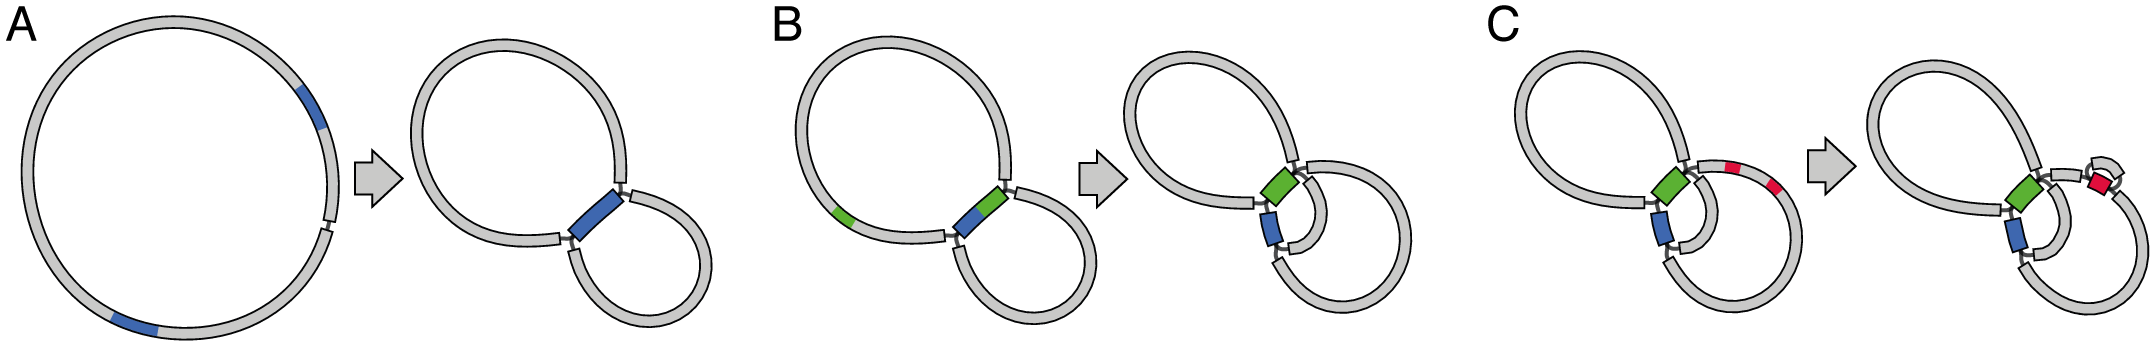
Bandage: Look and edit the graph
Bandage is a program to visualize a assembly graph
Example from The New York Times: “Team of Rival Scientists Comes Together to Fight Zika”. March 30, 2016
