Class 1: Why Systems Biology?
Systems Biology
Andrés Aravena, PhD
October 05, 2023
Welcome
Today’s questions
Who
What
How
When
Who?
I am Andres Aravena
- Assistant Professor at the Molecular Biology and Genomics Department
- Mathematical Engineer, U. of Chile
- PhD Informatics, U Rennes 1, France
- PhD Mathematical Modeling, U. of Chile
- not a Biologist
- but an Applied Mathematician who can speak “biologist language”
What?
What is this?
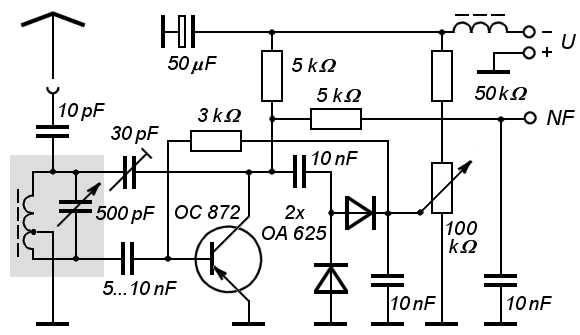
and what is this one?

It can get really complex

Engineers use networks to model systems
We want to build radios and devices within several constraints
- within a budget (money)
- using fewer resources (energy, materials)
- for a specific purpose
- with a narrow margin of error
- with few secondary effects
Systems are collections of interacting parts
Each part can be simple
The emergent behavior can be complex
We model a system to understand, predict, and control its behavior
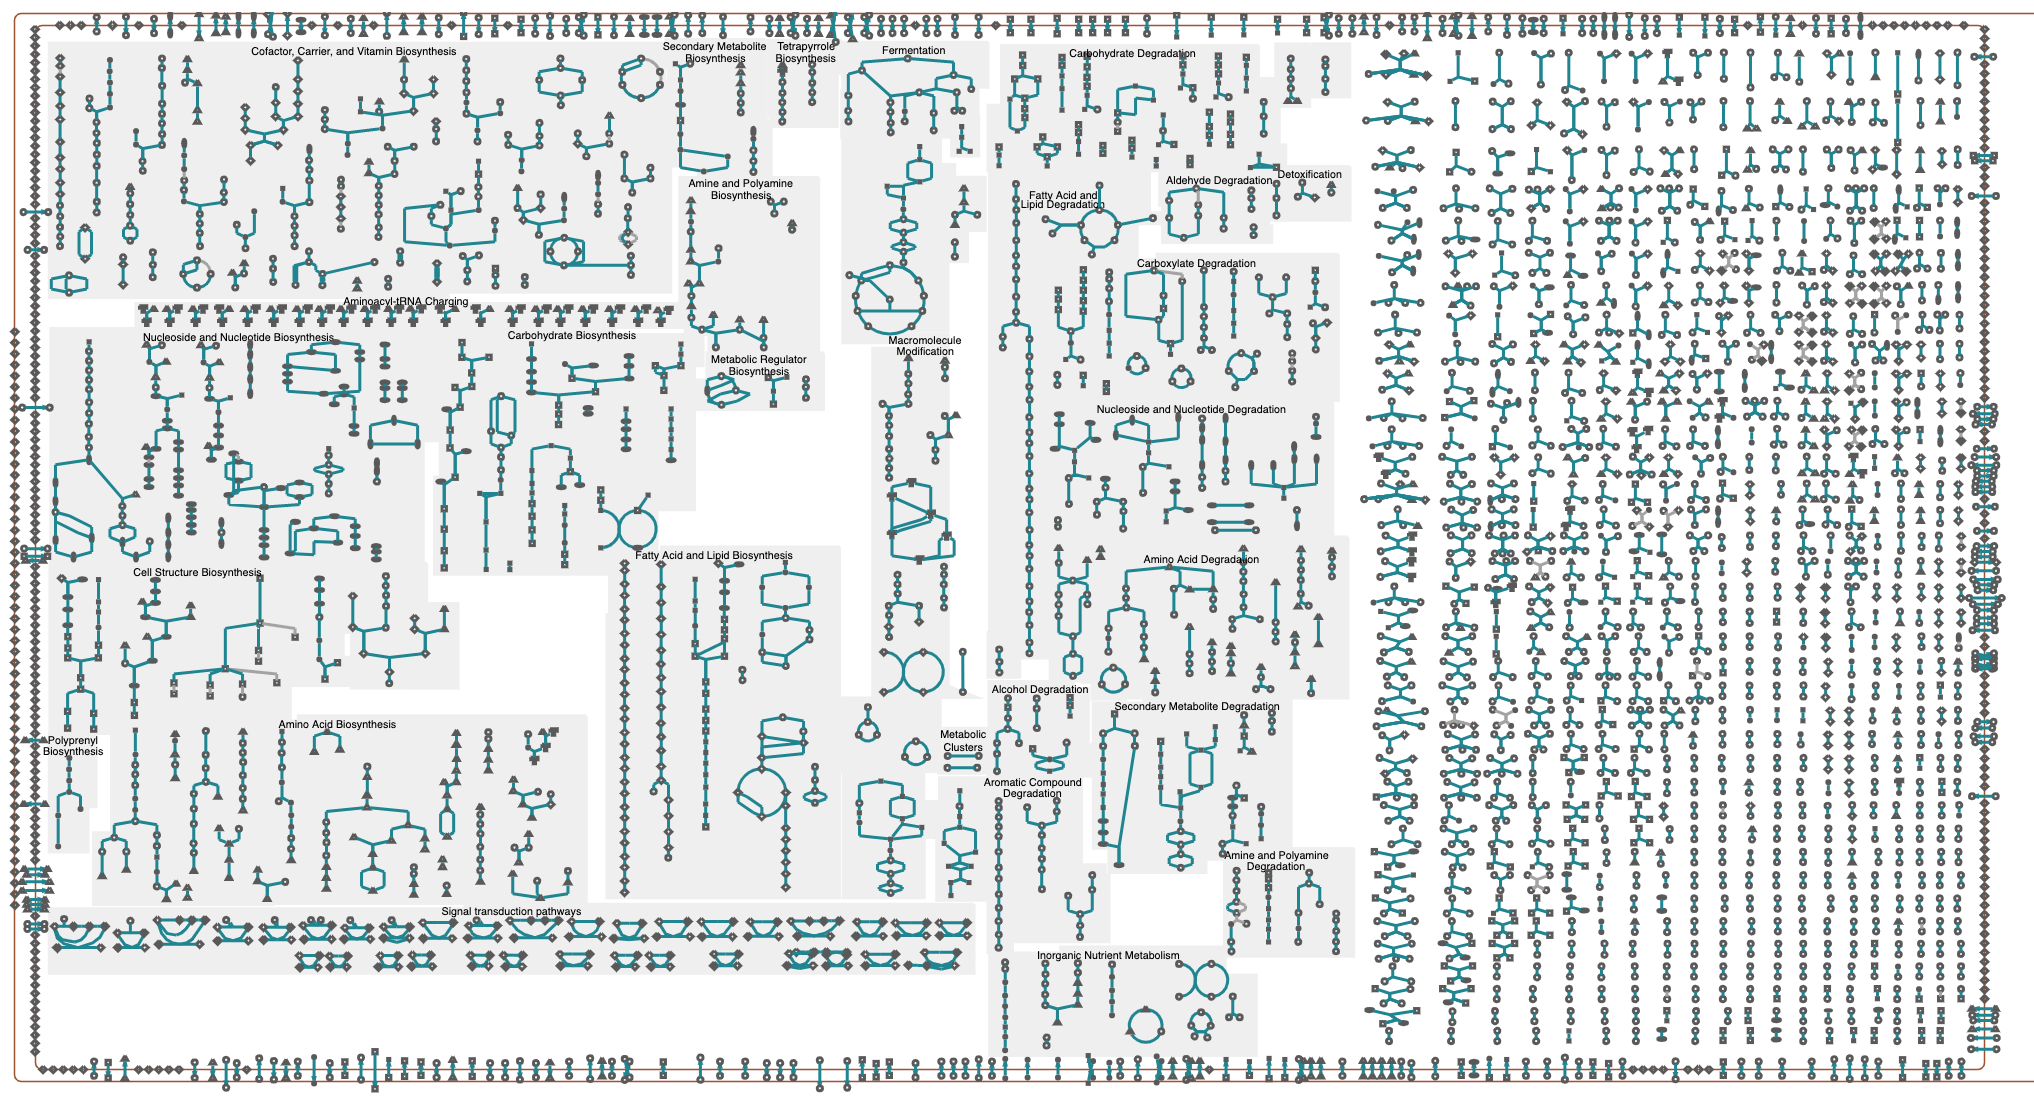
Metabolic map of E.coli
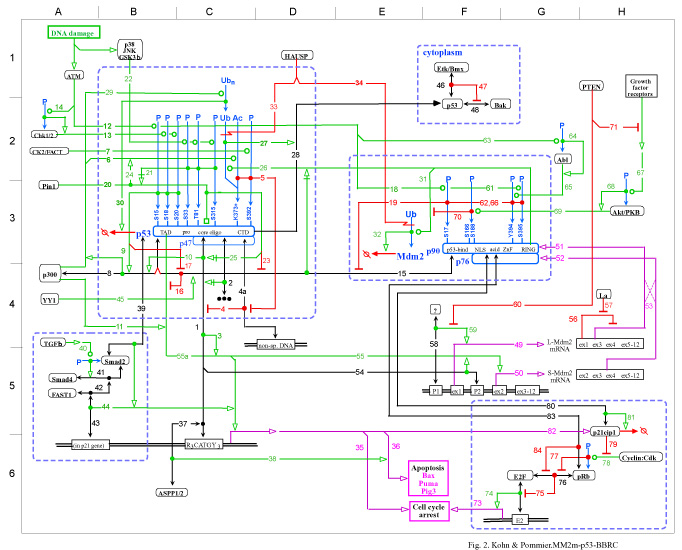
Molecular interaction maps
Good diagrams follow some rules
- The meaning of each symbol must be clear to everybody
- Need for standardization
- Technical details of each part should be explicit
- Interactions between parts should be explicit
A good representation allows simulation and predictions
Systems Biology Graphic Language
Process description map, Drosophila cell cycle, doi:10.1371/journal.pcbi.1005740

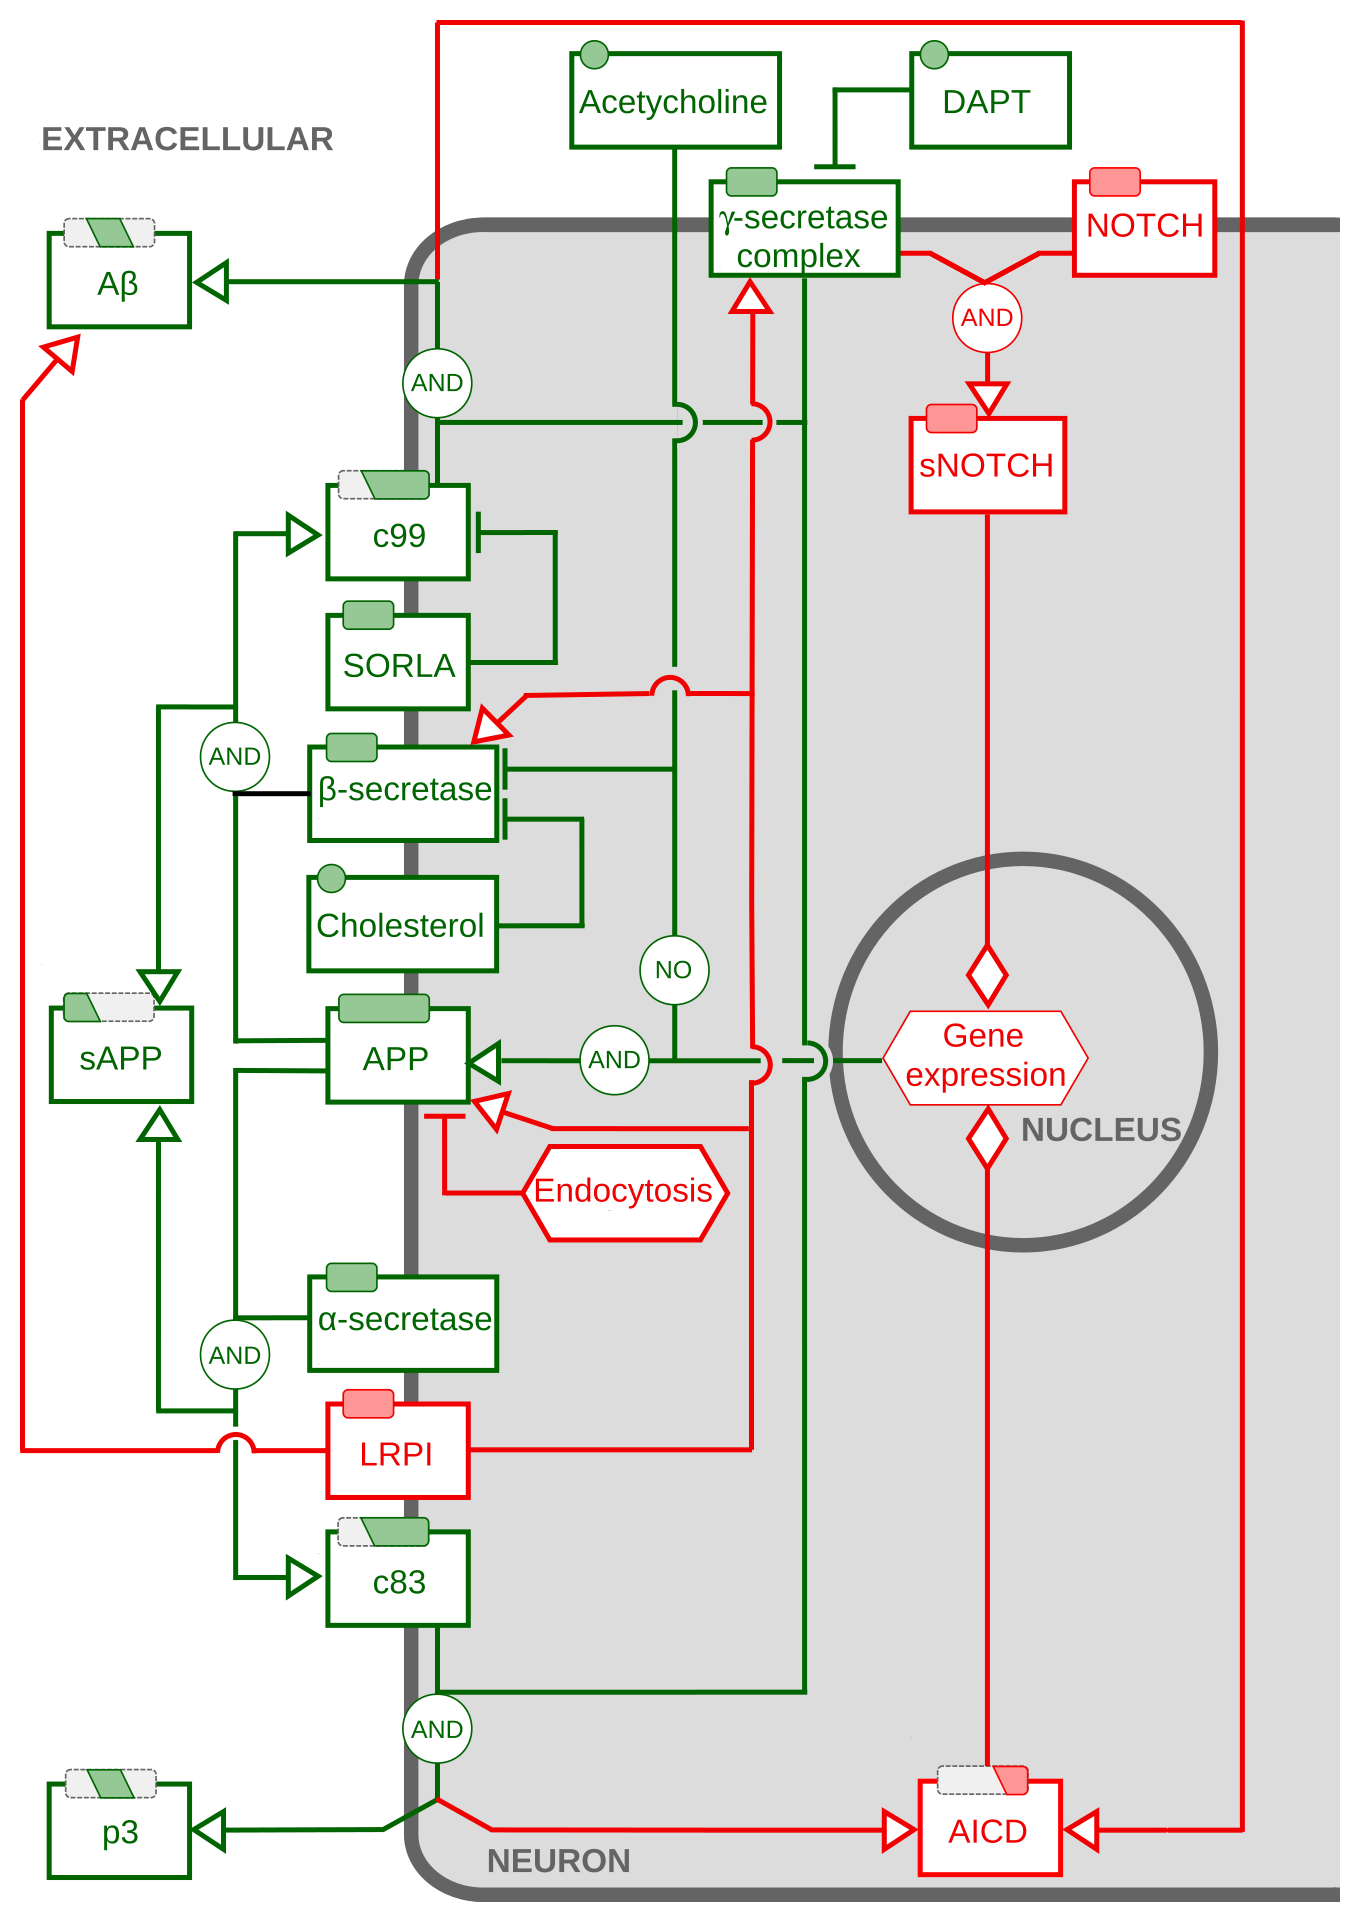
Activity flow map
Protein precursor processing, doi:10.1002/psp4.12155
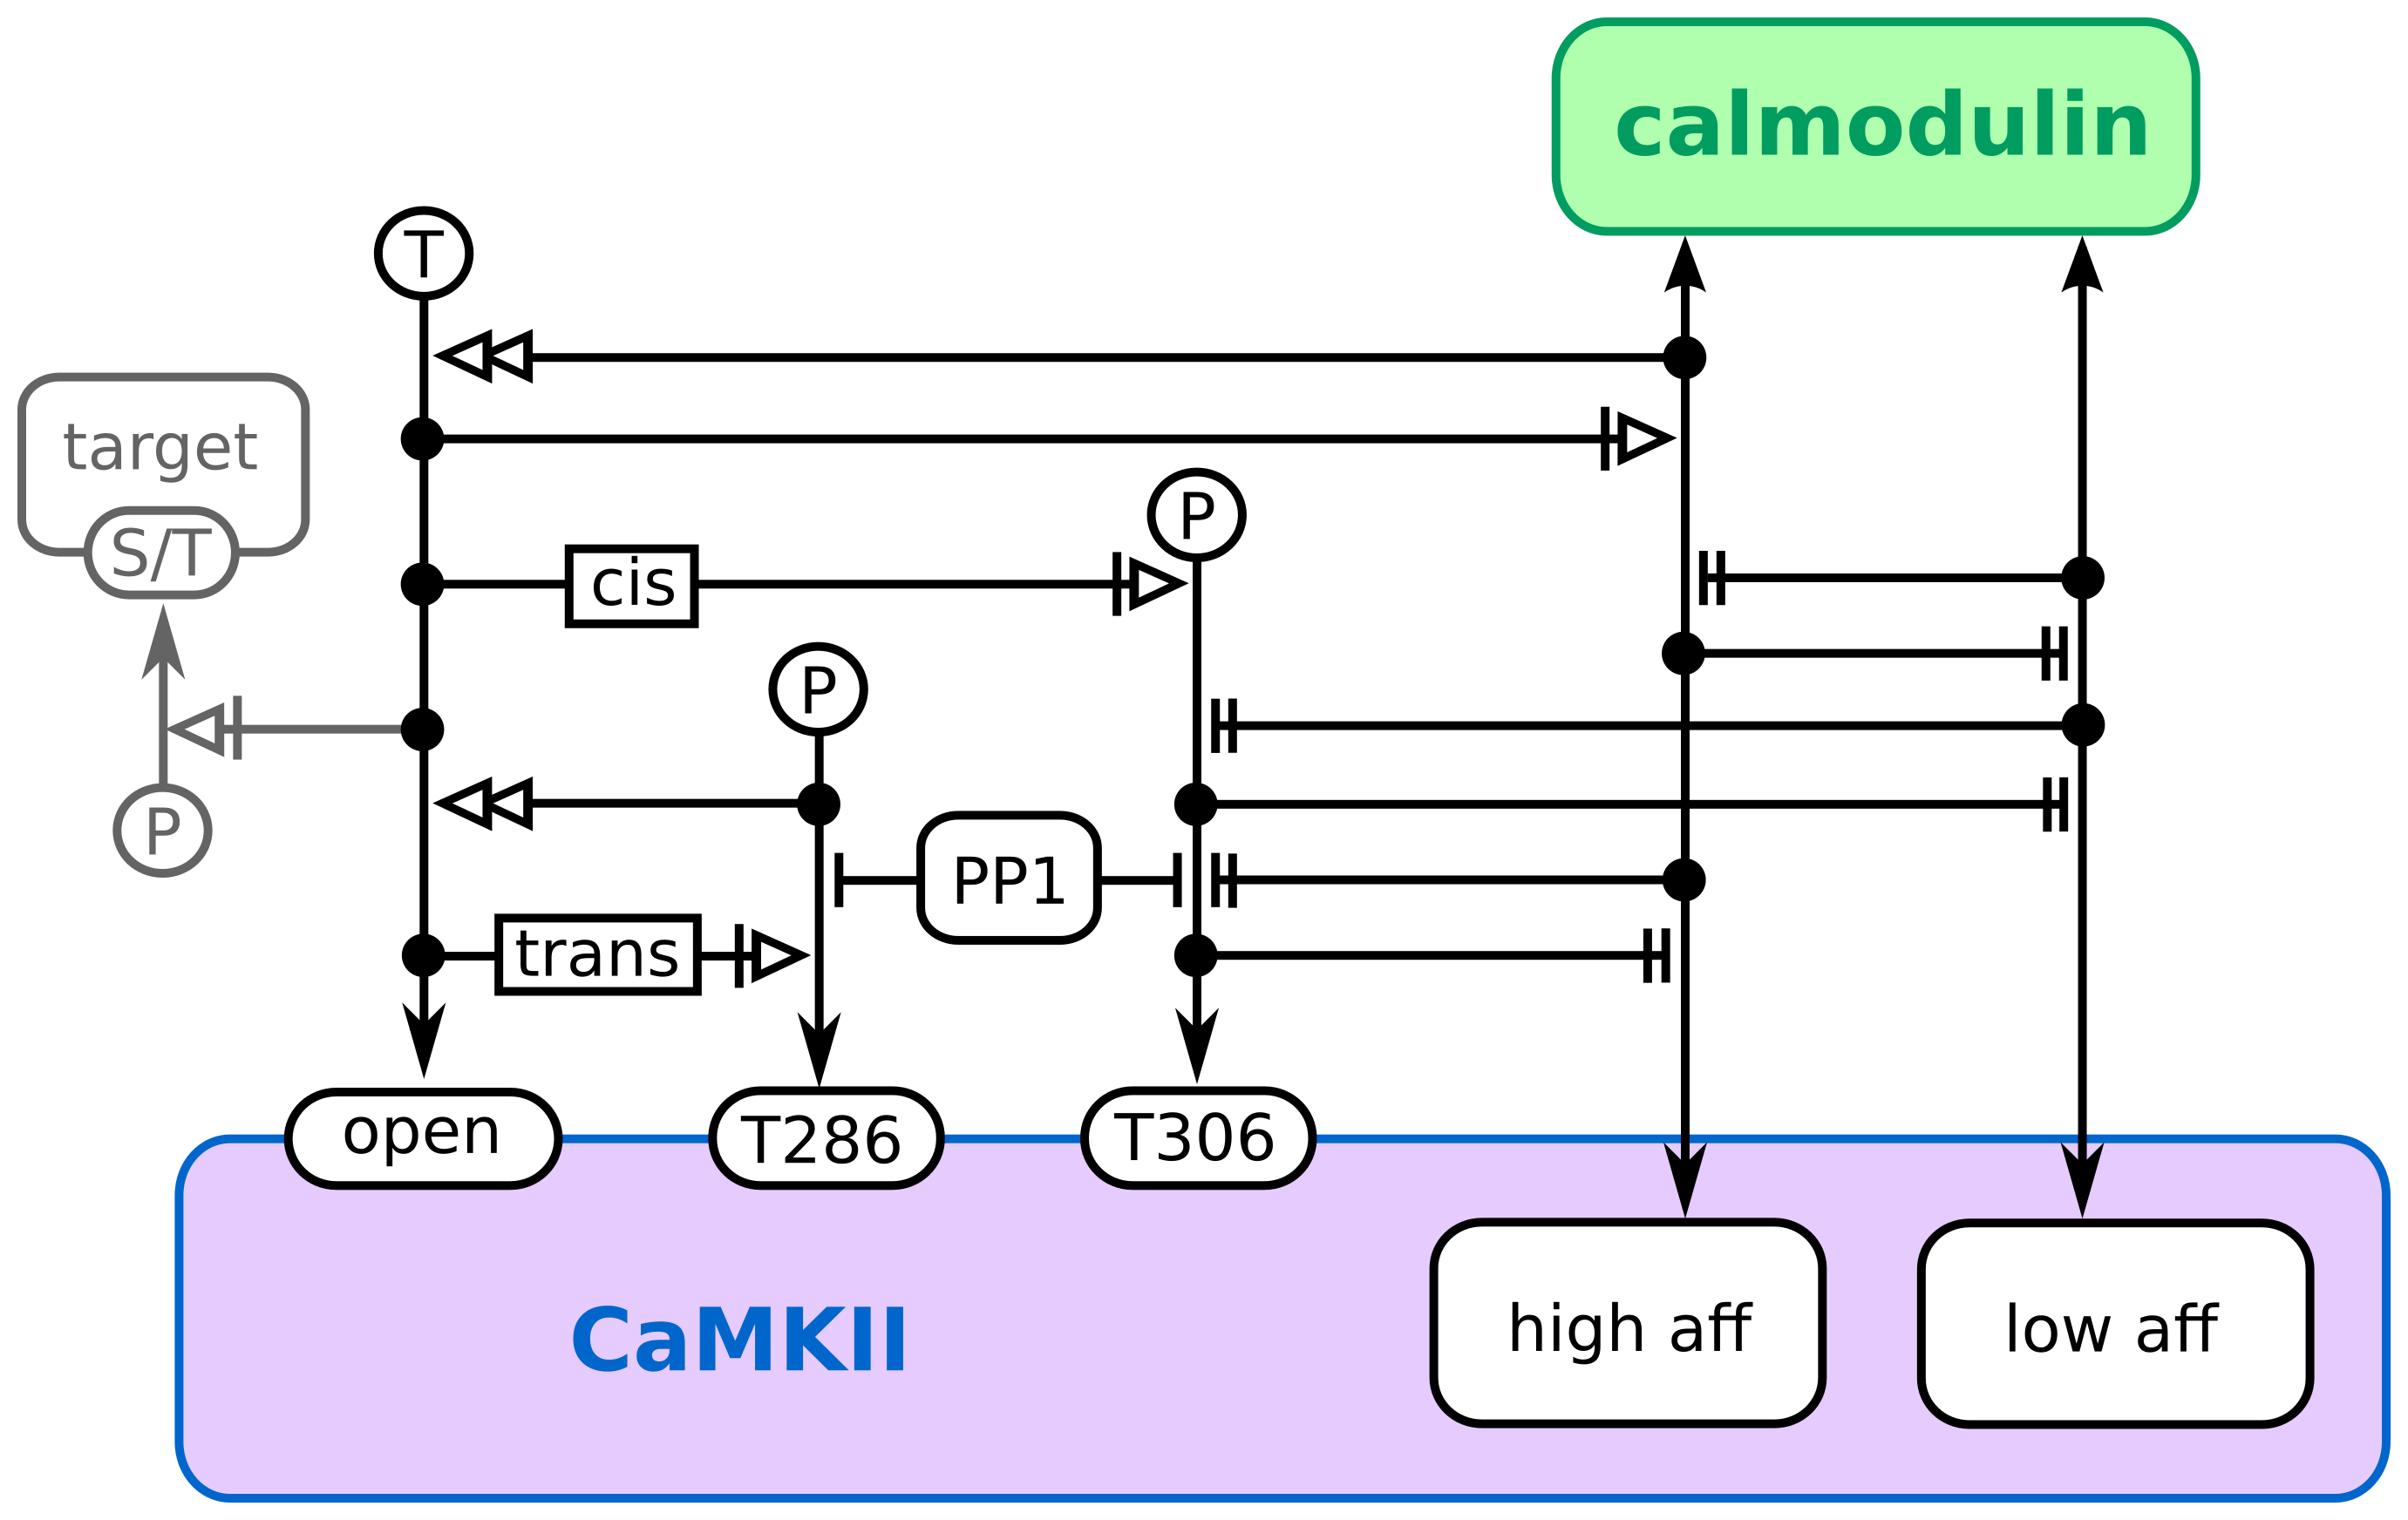
Entity Relationship map
CaMKII regulation by calmodulin, doi:10.1371/journal.pone.0029406
How does this fit in the Big Picture of Science
An operational definition of Science
Scientist work is to understand Nature
We start by Observing Nature, usually measuring values.
These are exploratory experiments.
The thing we study must be repetible, and we need to see that repetition.
We can find them using plots, linear models, clustering, etc.
This is the most important part.
Good answers to bad questions are useless.
Good questions are good, even if we don’t have answers
We answer these questions using models and explanations
Valid models should make predictions that we can test in the lab…
These are validation experiments.
If the results do not match the prediction, we know that the explanation is wrong. Two steps back.
Now we publish our data and model, so other scientists validate or reject it.
The final validation is to be published.
If the paper is accepted and published, our work becomes part of our shared human knowledge.
The goal of Science is to produce new Knowledge.
When we observe Nature we use our previous Knowledge
We look for new Patterns that raise new Questions.
“Noise becomes Signal”
Details
- Our Observations depend on our previous Knowledge
- The first step is to Find Patterns
- The key is to ask Good Questions
- Explanations are “models”, in a broad sense
- Valid models should produce new Predictions
- Observations and Test can be done in the lab
- “Knowledge” means Published
- Authority is not relevant
Characterization of Science
- About “outside”
- About visible things
- Things that you can measure
- Provides Explanations
- They must be Logic and Coherent
- Peer reviewed
- Replicable
Assumptions of Science
- There is an “objective reality” outside us
- The reality has some rules
- It is not (completely) random. There are rules
- The rules are “logic”
- The rules do not change
- We may not see the rules directly
- We can (in theory) discover these rules using reason
How?
Interaction networks
Unfortunately, we do not have time to study all kinds of networks relevant in molecular biology
(at least, not in this course)
We will focus on interaction networks
That is, networks that can be built from gene expression data
Gene expression
In other words we will speak about
Transcription
We will learn to analyze gene expression, so we can design better experiments and achieve higher impact
Big plan
This course has basically three parts
- Finding differentially expressed genes
- evaluating differential expression
- using pre-normalized data
- statistical tests
- linear models
- Building interaction networks
- Normalizing gene expression data
Practical details
Course’s blog
My blog is at https://www.dry-lab.org/
Course’s blog at https://www.dry-lab.org/blog/2023/sysbio/
All material will be published there
Diagnostic quiz

Measuring Gene Expression
More precisely, mRNA concentration
What is the question?
We want to know
- Which genes are being expressed
- How much of each gene is being expressed
- How does expression change
- In time
- Under different conditions
- Between strains/mutants/cell lines
The Big Assumption
Measuring protein concentration is hard
We assume that protein concentration is proportional to mRNA concentration
- Which genes are being transcribed
- How much of each gene is being transcribed
- How does transcription change
- In time
- Under different conditions
- Between strains/mutants/cell lines
How to measure mRNA concentration?
Basically
- qPCR
- Microarrays
- RNAseq
qPCR
If you have primers for each gene
- specific to each gene
- thermodynamically stable
- efficient
Raw data: CT value for each gene/condition
and CT value for calibration reference
Hybridization methods
Southern/Northern/Western blot can detect, but not quantify
(I think so. I’m not a biologist)
Instead, we have macro- and microarrays
Raw data: Light intensity (luminescence) in one or more wave length
This is measured in arbitrary units, and is a number between
0 and 65536
(that is, a 16-bits value)
RNAseq
mRNA is retro-transcribed and fragmented.
Fragments are sequenced. Reads are aligned to reference genome
Raw data: SAM/BAM file with location of each read in the reference genome
Processed data: Number of reads per gene, normalized by gene length
Data source: NCBI GEO
Gene Expression Omnibus
- Platforms
- Samples
- Series
- Data Set
- Profile
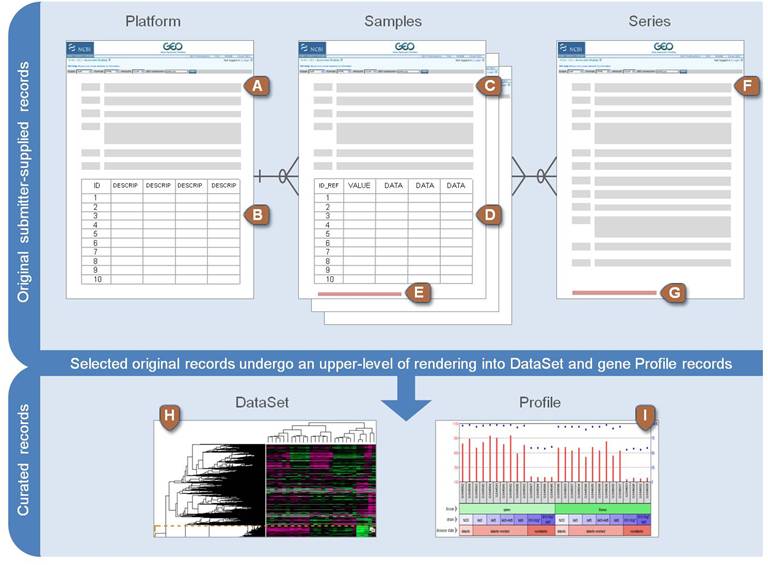
Relevant Objects in GEO
- GEO Platform
- Set of probes used in one or more experiment. Type of microarray slide, qPCR primers, including controls.
- GEO Samples
- a specific result of a single experiment. Raw RNA concentration for each probe in the platform
- GEO Series
- Set of Samples from a complete experiment. Includes technical and biological replicas
other Relevant Objects in GEO
- GEO Datasets
- Sets of samples from different experiments that can be compared. For example, using the same platform
- GEO Profiles
- individual gene expression profiles assembled from GEO. Follows a single gene through several conditions
NCBI GEO data structure
Example
Let’s take a look at
GSE56896
Types of files
NCBI standard
- SOFT
- MINiML
- Series Matrix
Industry standard
- CEL (Affymetrix)
- GPR
- FASTQ (NGS)
- SAM/BAM (RNAseq)
Home exercise
These are optional, try at least one.
- Learn how to read these files in your computer
- They are usually compressed
- Do not use Word
- If you use Excel, be careful
- Learn how to get data from the European Database
- Bring your own data
Write a document (in English) explaining your results