Class 26: Bayes’ Theorem
Methodology of Scientific Research
Andrés Aravena, PhD
May 5, 2023
Why you should learn (some) math
70% of the world population got one or more dosis of COVID-19 vaccine
Today, according to “Our World in Data”
In other words, more than 30% of people has not been vaccinated
Why?
There are many reasons
Only 29.7% of people in low-income countries have been vaccinated
In rich countries we observe vaccine hesitance
Why people do not want to be vaccinated?
Again, there are many reasons
Political
Belief
Distrust of Science
Some people distrust Science
Besides the Anti-vaccine people, we have
Climate change denial
Flat Earthers
and several others
Can Science be trusted?
PLOS Medicine 2005

Most Scientists are honest
In 2009, 2% of scientists admitted to falsifying studies at least once
14% admitted to personally knowing someone who did
The problem is not dishonesty
Most people do not lie
Replicability crisis
A 2016 poll of 1,500 scientists reported that 70% of them had failed to reproduce at least one other scientist’s experiment
50% had failed to reproduce one of their own experiments
There are problems with the experiments and their analysis
Science August 2015•vol 349 issue 62519
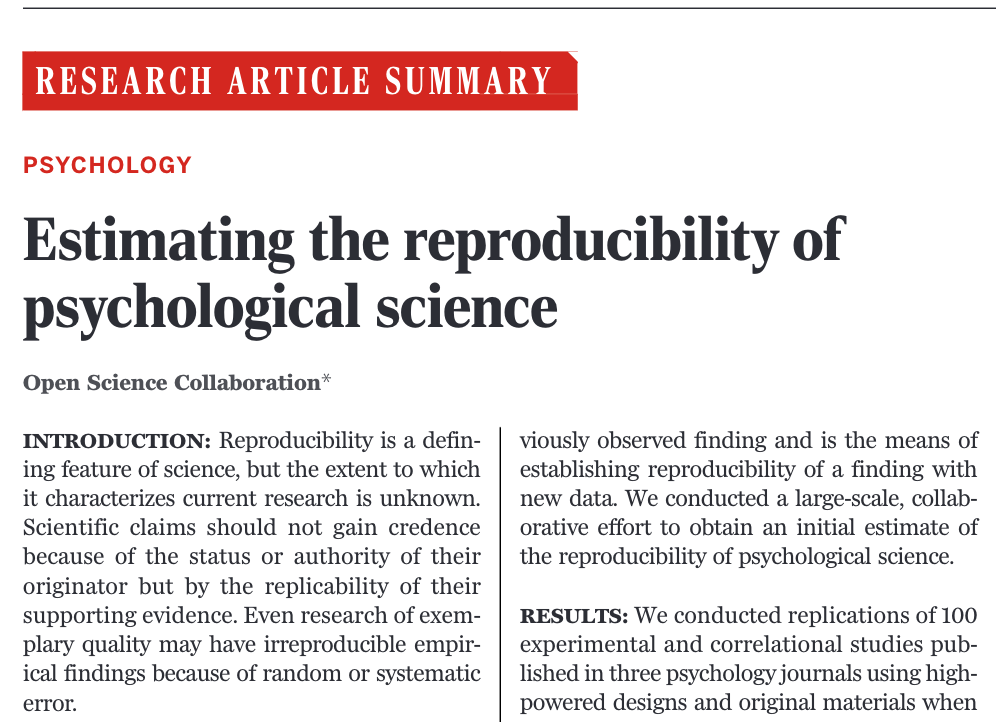
Summary
Repeated the top 100 studies in psychology
- Only 36% of the replications gave significant findings
- compared to 97% of the original studies
- The effect size in the replications was half of the effect size in the original studies, on average
This is not limited to psychology
Why does this happens?
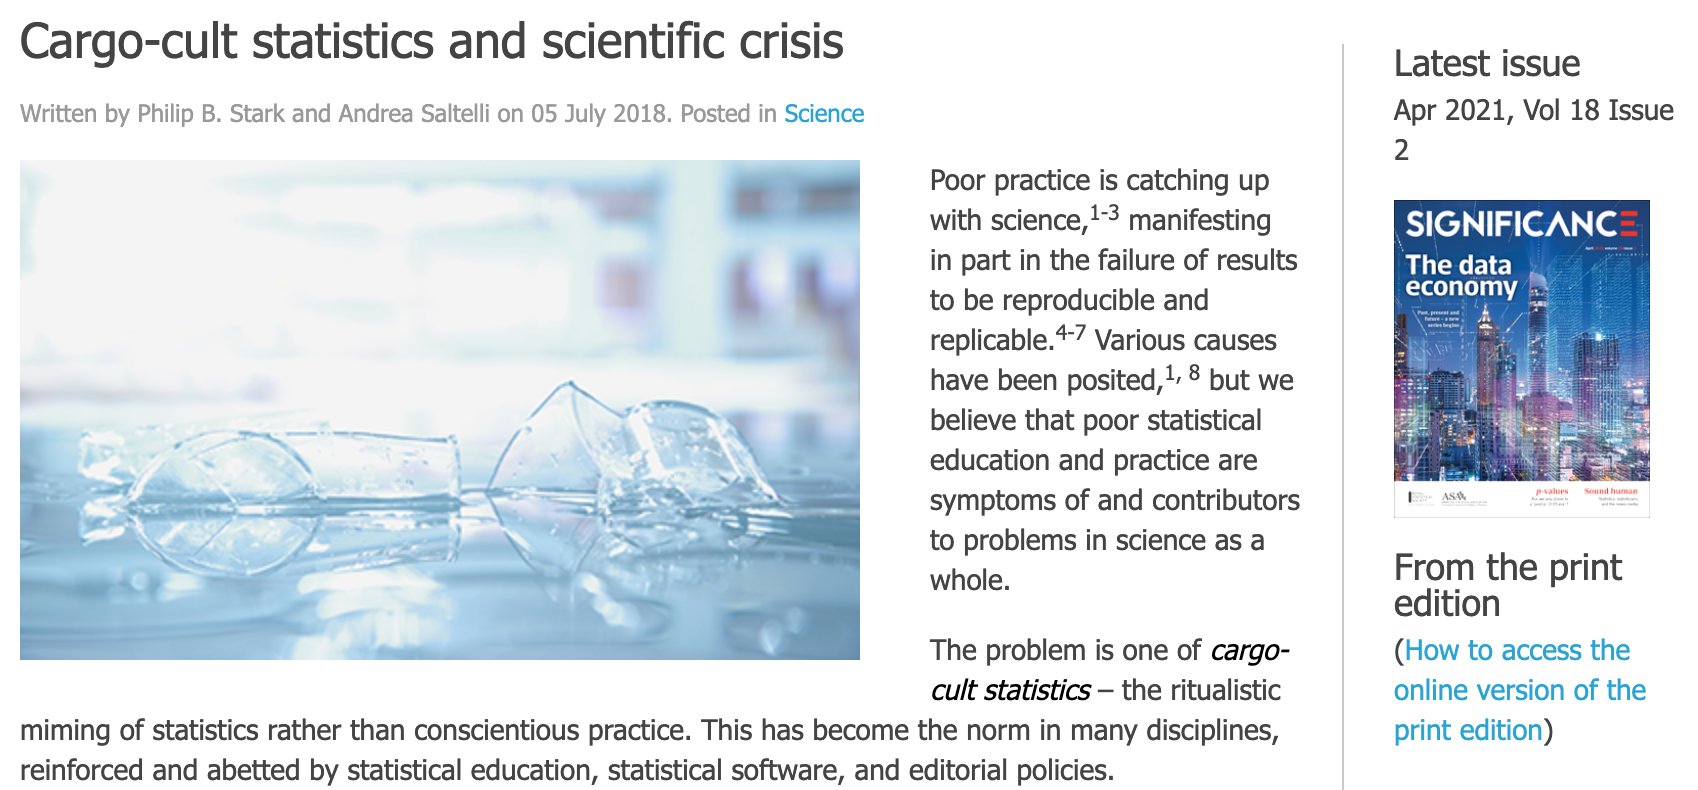
Journal of the Royal Statistical Society and American Statistical Association
Cargo cults

This has been said before

Richard Feynman
- Physicist
- Excellent professor
- Worked in the Manhattan Project at 25 years old
- Nobel Prize on Physics in 1965
- He was talking about USA in the 1970s
Cargo-cult statistics
“the ritualistic miming of statistics rather than conscientious practice”
Cargo-cult statistics and scientific crisis
“practitioners go through the motions of fitting models, computing p-values or confidence intervals, or simulating posterior distributions”
“They invoke statistical terms and procedures as incantations, with scant understanding of the assumptions or relevance of the calculations, or even the meaning of the terminology”
The authors say
“We believe that poor statistical education and practice are symptoms of and contributors to problems in science as a whole”
My opinion
As someone who teaches maths and statistics, I say
We are bad at teaching maths
We need to find better ways to teach math
(in particular to math teachers)
Math is a superpower
Math allow us to travel in time, and see the invisible
That is why people who knows do not want to teach math:
It gives power to the people
“They” do not want you to know math
Quick example
Example: diagnosis
Imagine that you are randomly chosen for a test of COVID-19
The result is “positive”. It says that you have the virus
But this test fails 2% of times, giving a false positive or a false negative
Then the question:
What is the probability that you have COVID-19 given that the test said “positive”?
It is not 98%
The test is correct 98% of times
That is, the probability of a positive test given that you have COVID
But we really want to know the probability of COVID given that the test is positive
They are not the same
We need to know the base rate
To answer this question we must know the prevalence of COVID
That is, what is the proportion of the population with COVID
There were 728,692 active cases in Turkey last year
(only 1,128 were serious)
Population of Turkey is 85,828,516
Dividing both numbers we find that the prevalence is 0.86%
Let’s see why
Let’s assume that:
- There are one million people
(this will make it easy to calculate) - The test has a precision of 98%
- The prevalence of COVID in the population is 0.86%
- The people to test is chosen randomly from the population
Let’s fill this matrix
| Test- | Test+ | Total | |
|---|---|---|---|
| COVID- | . | . | . |
| COVID+ | . | . | . |
| Total | . | . | . |
COVID reality in the rows and test results in the columns
Let’s assume that there is a million people
| Test- | Test+ | Total | |
|---|---|---|---|
| COVID- | . | . | . |
| COVID+ | . | . | . |
| Total | . | . | 1000000 |
We will fill this matrix in the following slides
Assuming one million people makes the math easier
0.86% of them are COVID positive
| Test- | Test+ | Total | |
|---|---|---|---|
| COVID- | . | . | 991400 |
| COVID+ | . | . | 8600 |
| Total | . | . | 1000000 |
Prevalence is the percentage of the population that has COVID.
In other words, it is the probability of (COVID+)
98% are correctly diagnosed
| Test- | Test+ | Total | |
|---|---|---|---|
| COVID- | 971572 | . | 991400 |
| COVID+ | . | 8428 | 8600 |
| Total | . | . | 1000000 |
Precision is the probability of a correct diagnostic
(Here we assumed that the error rates are the same for positive and negative. That may not be the case always)
2% are wrongly diagnosed
| Test- | Test+ | Total | |
|---|---|---|---|
| COVID- | 971572 | 19828 | 991400 |
| COVID+ | 172 | 8428 | 8600 |
| Total | . | . | 1000000 |
(this error rate is only an example. Real tests are usually better)
Total people diagnosed
| Test- | Test+ | Total | |
|---|---|---|---|
| COVID- | 971572 | 19828 | 991400 |
| COVID+ | 172 | 8428 | 8600 |
| Total | 971744 | 28256 | 1000000 |
We sum and fill the empty boxes
28256 people got positive test, but only 8428 of them have COVID
Probability of having COVID if the text is positive: 29.83%
References
Erika Check Hayden, Weak statistical standards implicated in scientific irreproducibility Nature, 11 November 2013
Open Science Collaboration, Estimating the reproducibility of psychological science. Science 28 Aug 2015: Vol. 349, Issue 6251, aac4716
Replications can cause distorted belief in scientific progress Behavioral and Brain Sciences, Volume 41, 2018, e122 DOI: https://doi.org/10.1017/S0140525X18000584. Published online by Cambridge University Press: 27 July 2018
More References
Reproducibility of Scientific Results Stanford Encyclopedia of Philosophy
T.D. Stanley, Evan C. Carter and Hristos Doucouliagos What Meta-Analyses Reveal about the Replicability of Psychological Research Deakin Laboratory for the Meta-Analysis of Research, Working Paper, November 2017
Silas Boye Nissen, Tali Magidson, Kevin Gross Is a corresponding author, Carl T Bergstrom Research: Publication bias and the canonization of false facts eLife Dec 20, 2016; 5:e21451
Who do you want to be?


Bayes
Bayes Theorem
“An Essay towards solving a Problem in the Doctrine of Chances” is a work on the mathematical theory of probability by the Reverend Thomas Bayes, published in 1763, two years after its author’s death
The use of the Bayes theorem has been extended in science and in other fields
From Wikipedia, the free encyclopedia
Bayes rule
Since we have \[ℙ(A, B) = ℙ(A)⋅ ℙ(B|A)\] and, by symmetry, we also have \[ℙ(A, B) = ℙ(B)⋅ℙ(A|B)\] then we conclude that \[ℙ(A)⋅ ℙ(B|A) = ℙ(B)⋅ℙ(A|B)\]
Dividing by \(ℙ(A)\)
We can reorganize everything as \[ℙ(B|A) = \frac{ℙ(B)⋅ℙ(A|B)}{ℙ(A)}\]
This is known as Bayes’ Rule or Bayes’ Theorem
One of the most famous theorems
What does it mean
It can be understood as \[ℙ(B|A) = ℙ(A|B)⋅\frac{ℙ(B)}{ℙ(A)}\] which is a rule to reverse the order of the conditional probability
It shows us how to go from \(ℙ(A|B)\) to \(ℙ(B|A)\)
This is the view we will use now
How do we learn
Another point of view is \[ℙ(B|A) = \frac{ℙ(A|B)}{ℙ(A)}⋅ℙ(B)\] which is a rule to update our opinions
- \(ℙ(B)\) is the a priori probability
- \(ℙ(B|A)\) is a posteriori probability
Bayes says how to change \(ℙ(B)\) when we learn \(A\)
“When the facts change, I change my opinion. What do you do, sir?”
John Maynard Keynes (1883 – 1946), English economist, “father” of macroeconomics
We need \(ℙ(A)\)
We can write \(ℙ(A)\) as \(ℙ(A,B) + ℙ(A,\text{not } B)\)
which can be rewritten as \[ℙ(A) =
ℙ(B)⋅ℙ(A|B) + ℙ(\text{not } B)⋅ℙ(A|\text{not } B)\] therefore we
have a second formula for Bayes’ rule \[ℙ(B|A) = \frac{ℙ(B)⋅ℙ(A|B)}{ℙ(B)⋅ℙ(A|B) +
ℙ(\text{not } B)⋅ℙ(A|\text{not } B)}\]
We did it before
When we filled the “diagnostic” matrix, we did this
| not A | A | Total | |
|---|---|---|---|
| not B | \(ℙ(\text{not }A,\text{not }B)\) | \(ℙ(A,\text{not } B)\) | \(ℙ(\text{not } B)\) |
| B | \(ℙ(\text{not } A, B)\) | \(ℙ(A|B)\) | \(ℙ(B)\) |
| Total | \(ℙ(\text{not } A)\) | \(ℙ(A)\) | \(1\) |
To get \(ℙ(A, B)\) we used \(ℙ(B)⋅ℙ(A|B)\)
Here \(A\) is “test positive” and \(B\) is “having COVID”
Diagnostics Using Bayes Theorem
We want to evaluate the probability of having COVID, given that the test is positive \[ℙ(\text{COVID}_+ | \text{test}_+)\] given that we know the prevalence \(ℙ(\text{COVID}_+)=0.0086\) and the precision \[ \begin{aligned} ℙ(\text{test}_+ | \text{COVID}_+)=0.98\\ ℙ(\text{test}_- | \text{COVID}_-)=0.98 \end{aligned} \]
What is the probability of being sick given that the test is positive?
\[ℙ(\text{COVID}_+ | \text{test}_+)=\frac{ℙ(\text{test}_+ | \text{COVID}_+)⋅ℙ(\text{COVID}_+)}{ℙ(\text{test}_+)}\]
We need to know \(ℙ(\text{test}_+),\) which we can get as
\[ℙ(\text{test}_+)= ℙ(\text{test}_+, \text{COVID}_+)+ ℙ(\text{test}_+, \text{COVID}_-)\]
We can calculate them
\[\begin{aligned} ℙ(\text{test}_+, \text{COVID}_+)& =ℙ(\text{test}_+ \vert \text{COVID}_+)\cdotℙ(\text{COVID}_+)\\ & =0.98⋅ 0.0086 = 0.008428 \end{aligned} \] and \[ \begin{aligned} ℙ(\text{test}_+, \text{COVID}_-)& =ℙ(\text{test}_+ \vert \text{COVID}_-)\cdotℙ(\text{COVID}_-) \\ & =(1-0.98)⋅ (1-0.0086) \\ & =0.02⋅0.9914 = 0.019828 \end{aligned} \]
Finally, we find the value we were looking for
\[ \begin{aligned} ℙ(\text{COVID}_+ | \text{test}_+) & = \frac{ℙ(\text{test}_+ | \text{COVID}_+)⋅ℙ(\text{COVID}_+)}{ℙ(\text{test}_+)}\\ & = \frac{0.98⋅0.0086}{0.98⋅0.0086 + 0.02⋅0.9914} \\ & = \frac{0.008428}{0.008428 + 0.019828} \\ & = 0.2983 \end{aligned} \]
Prob of having COVID given positive test is near 30%
(assuming there are no other symptoms, or other information)
Exercise
We would like to have no errors, but errors are usually unavoidable. The technology used will limit the precision of diagnostics.
In practice, diagnostic test designers know that telling that you are healthy when you are sick is much worse than telling that you are sick when you are healthy. In other words, the cost of a false positive is usually lower than the cost of a false negative.
Of course the costs depend on the disease and in the technique.
What happens if the false positive rate is different from the false negative rate?
\[\begin{aligned} ℙ(\text{test}_+ \vert \text{COVID}_+)=a\\ ℙ(\text{test}_- \vert \text{COVID}_-)=b \end{aligned} \]