Class 20: Many variables in linear models
Methodology of Scientific Research
Andrés Aravena, PhD
April 13, 2023
Dataset
For this part we will use the following data
https://dry-lab.org/static/students.txt
These are self-reported values from former students
Load in your spreadsheet and plot
- weight_kg versus height_cm
- weight_kg versus hand_span
First two models
We want two models for weight_kg
- One based in height_cm \[\text{weight_kg} = β_0 + β_1⋅\text{height_cm}\]
- One based in hand_span \[\text{weight_kg} = β_0 + β_1⋅\text{hand_span}\]
Obviously, \(β_0\) and \(β_1\) on each model are independent. This
time we can use SLOPE() and INTERCEPT().
Please do it now
Which one is better?
We have tools to evaluate the quality of the model
Please use them to evaluate both models
Also, evaluate the sum of squared errors for each model
Another Spreadsheet function
Besides SLOPE() and INTERCEPT(), there is
another function
We can get both at the same time using LINEST()
This is an advanced function that returns several values
It has some optional parameters that we will study later
Please use it and compare with the previous results
Combining both models
We have two ways to predict weight_kg
We want to combine them
\[\text{weight_kg} = β_0 + β_1⋅\text{hand_span} + β_2⋅\text{height_cm}\]
Now we have to find three parameters
What are the conditions for these parameters?
How can we
find them?
Finding all model’s parameters
The formula for \((β_0, β_1, β_2)\) is complex. We will not teach it
Instead, we will use the LINEST() function
This is the main advantage of LINEST()
LINEST() can model using several independent
variables
Exercise
Evaluate Mean Squared Error and \(R^2\) for the large model
Which one is the better now?
Modeling free fall
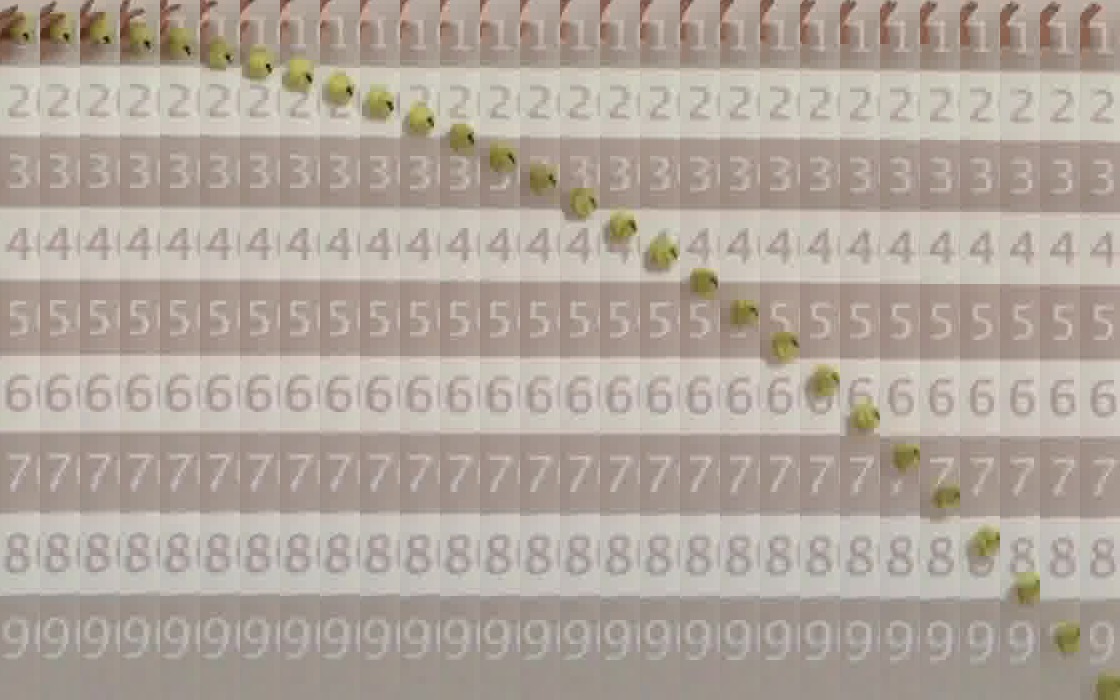
Example videos
YouTube has an option to show the video at 0.25 speed. Try it
Summary of the video

We analyzed the video
We got time and position from the video
You can get the data at
https://dry-lab.org/static/2020/cmb1/free-fall.csv
There is another version using comma as decimal separator
https://dry-lab.org/static/2020/cmb1/free-fall-eu.csv
Read them in your spreadsheet
Looking for the straight line
Plot the data directly
Then in semi–log scale
Then in log–log scale
Which one would you choose?
This is not any exponential
There are many possible functions that connect \(x\) and \(y\)
We will try a polynomial formula
A polynomial is a formula like \[y=β_0 + β_1\cdot x + β_2\cdot x^2 +\cdots+ β_n\cdot x^n\]
The highest exponent is the degree of the polynomial
We will try a 2-degree formula \[y = β_0 + β_1\cdot x + β_2\cdot x^2\]
We will use a polynomial model
\[\text{distance}=β_0 + β_1\cdot\text{time}+β_2\cdot\text{time}^2\] This is a parabola, which can be modeled with a second degree polynomial
When we use a polynomial model, we need to add new columns
In this case we need to add time_sq containing time2
This is used only for the model
Time starts at zero
- In the video the timer starts before dropping the ball
- The first data is when the ball crosses 10
- We choose this as our time reference
- The ball is already moving. Speed is not zero
- Initial speed is not zero
\(β_0\) should be 0
Since we choose that at time=0 we have distance=0, we know that \(β_0\) is 0
In other words, our model here is \[y =β_1\cdot x + β_2\cdot x^2\]
The old \(β_0\) has a fixed value of 0
How do we do that in Excel?
Meaning of the coefficients
If you remember your physics lessons, you can recognize that in the formula \[y =β_1\cdot x + β_2\cdot x^2\] the value \(β\) is the initial speed, and \(β_2=-g/2\)
Thus, we can measure the gravitational acceleration in the second coefficient