Class 13: Descriptive Statistics
Methodology of Scientific Research
Andrés Aravena, PhD
March 28, 2023
Descriptive Statistics
Our observations and experiments give us data
We want to tell something about them
What can we tell about this set of numbers?
How can we make a summary of all the values in a few numbers?
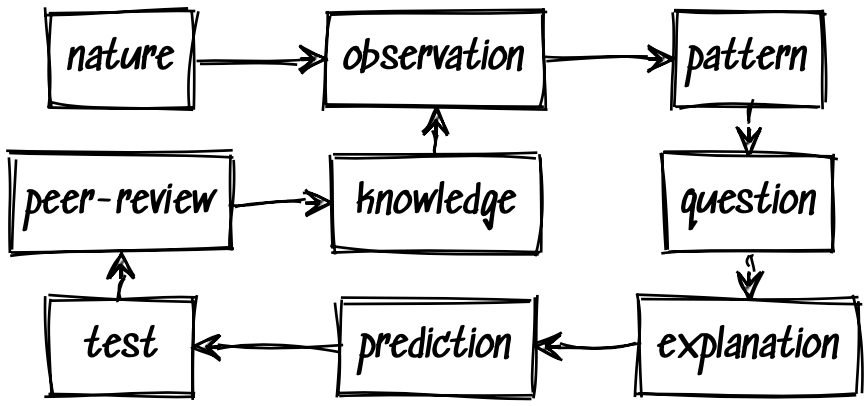
In the scientific method
Standard Data Descriptors
- Number of elements (How many?)
- Location (Where?)
- Dispersion (Are they homogeneous? Are they similar to each other?)
Location
Find the “best” representative
Assume we have a vector of \(n\) values \[𝐲=\{y_1, y_2, …, y_n \}\] If we want to describe the set \(𝐲\) with a single number \(x\), which would it be?
If we have to replace each one of \(y_i\) for a single number, which number is “the best”?
Better choose one that is the “less wrong”
How can \(x\) be wrong?
How can \(x\) be wrong?
Many alternatives to measure the error
- Number of times that \(x≠y_i\)
- Sum of absolute value of error
- Sum of the square of error
and maybe others
Absolute error
Absolute error when \(x\) represents \(𝐲\) \[\mathrm{AE}(x)=\sum_i |y_i-x|\]
Which \(x\) minimizes absolute error?
Practice
Let’s make a spreadsheet to find which value of \(x\) minimizes the absolute error for the set
\[\{3,5,8\}\]
Let’s go to Google Sheets
Median: minimum Absolute Error
We get the minimum absolute error when
- half of the values in \(𝐲\) are smaller than \(x\)
- half of the values in \(𝐲\) are bigger than \(x\)
In other words, \(x\) is the median of \(𝐲\)
The median minimizes the absolute error
How to calculate the median
We must sort all values, from smallest to largest, and pick the one in the middle
If there are an even number of values, there are two values (let’s say \(y_a\) and \(y_b\)) on the center
In that cases the median is \[\frac{y_a + y_b}{2}\]
It is not so easy
Since we have to sort all values, this can take a lot of time
Before electronic computers, people had to sort things manually
It was impossible to do if you had too many values
Instead, people used methods that did not require sorting
Squared error
The squared error when \(x\) represents \(𝐲\) is \[\mathrm{SE}(x)=\sum_i (y_i-x)^2\] Which \(x\) minimizes the squared error?
More practice
Let’s make a spreadsheet to find which value of \(x\) minimizes the squared error for the set
\[\{3,5,8\}\]
Minimizing SE using math
We can write \[\begin{aligned} \mathrm{SE}(x)&=\sum_i (y_i-x)^2 =\sum_i (y_i^2 - 2y_ix + x^2)\\ &=\sum_i y_i^2 - \sum_i 2 y_ix + \sum_i x^2\\ &=\sum_i y_i^2 - x\sum_i 2 y_i + n x^2\\ \end{aligned}\]
This is a second degree expression, corresponding to a parabola
Parabola
We have \[\mathrm{SE}(x) =\underbrace{n}_a x^2 - \underbrace{\sum_i 2 y_i}_b \, x+ \underbrace{\sum_i y_i^2}_c\] which has the form of \(ax^2+ bx + c\)
Let’s explore it in Geogebra
It looks like this

It has two roots

The minimum is in the middle of the roots

Roots of a second degree equation
When we have \(ax^2+ bx + c =0\) then the two roots are \[\begin{aligned} x_1 &= \frac{-b-\sqrt{b^2-4ac} }{2a}\\ x_2 &= \frac{-b+\sqrt{b^2-4ac} }{2a} \end{aligned}\] and the middle point is \[\frac{x_1 + x_2}{2} = \frac{-b}{2a}\]
Replacing the values
We have \[\mathrm{SE}(x) =\underbrace{n}_a x^2 - \underbrace{\sum_i 2 y_i}_b \, x+ \underbrace{\sum_i y_i^2}_c\] so the center point is \[\frac{-b}{2a}=\frac{\sum_i 2 y_i}{2n}=\frac{\sum_i y_i}{n}\]
Arithmetic Mean: minimum squared error
We get the minimum squared error when \(x\) is the mean
The arithmetic mean of \(𝐲\) is \[\text{mean}(𝐲) = \frac{1}{n}\sum_{i=1}^n y_i\] where \(n\) is the size of the set \(𝐲\).
Sometimes it is written as \(\bar{𝐲}\)
This value is usually called mean, sometimes average
Median and mean
are different
usually
Note: all values are positive
In the Squared Error formula, all values are positives
The parabola never crosses the horizontal axis
Therefore, there are no real roots, only imaginary ones
That happens when \[b^2-4ac≤0\]
We will use this result later
What does that mean
Replacing the values in \(b^2-4ac≤0\) we have \[\left(\sum_i 2 y_i\right)^2 - 4 n \sum_i y_i^2 ≤ 0\]
In other words, we must remember that \[\left(\sum_i y_i\right)^2 ≤ n\sum_i y_i^2\]
Alternative:
using calculus
Using derivatives
The error is \[\mathrm{SE}(x)=\sum_i (y_i-x)^2\]
To find the minimal value we take the derivative of \(SE\)
\[\frac{d}{dx} \mathrm{SE}(x)= 2\sum_i (y_i - x)= 2\sum_i y_i - 2nx\]
The minimal values of functions are located where the derivative is zero
Minimizing SE using calculus
Now we find the value of \(x\) that makes the derivative equal to zero.
\[\frac{d}{dx} \mathrm{SE}(x)= 2\sum_i y_i - 2nx\]
Making this last formula equal to zero and solving for \(x\) we found that the best one is
\[x = \frac{1}{n} \sum_i y_i\]
We will study calculus later
We do not need a lot of calculus
We show just some of the reasons why calculus is useful
- To calculate areas
- To find minimum or maximum values
- To understand complicated functions
All that, after the midterms
Properties of the mean
Values change when we change units
All values \(y_i\) are multiplied by a fixed constant \(k\)
\[\begin{aligned} \mathrm{mean}(k⋅𝐲) &= \frac{1}{n}\sum_{i=1}^n k⋅y_i\\ &= k⋅\frac{1}{n}\sum_{i=1}^n y_i\\ &= k⋅\mathrm{mean}(𝐲)\\ \end{aligned}\]
Sum of two vectors
\[\begin{aligned} \mathrm{mean}(𝐱+𝐲) &= \frac{1}{n}\sum_{i=1}^n (x_i+y_i)\\ &= \frac{1}{n}\sum_{i=1}^n x_i + \frac{1}{n}\sum_{i=1}^n y_i\\ &= \mathrm{mean}(𝐱)+\mathrm{mean}(𝐲)\\ \end{aligned}\]
Summary
For any numbers \(a\) and \(b\) we have \[\mathrm{mean}(a 𝐱 + b𝐲) = a⋅\mathrm{mean}(𝐱)+b⋅\mathrm{mean}(𝐲)\]
We say that the mean is linear (official name)
but a better name is additive
Comment about notation
We will work with sets of values, like \[\{y_1, y_2, …, y_n \}\] When we speak about all the set, we write \(𝐲\) in bold face
Sometimes the order is important.
In that case we write it as a vector or tuple \[(y_1, y_2, …, y_n)\] With \(\{…\}\) the order doesn’t matter. With \((…)\) it matters