Class 12: Drawing biological graphs
Systems Biology
Andrés Aravena, PhD
November 23, 2021
The scientific method

Graphs in Science
Explanations can be given in text or in drawings
A picture is worth a thousand words… or more
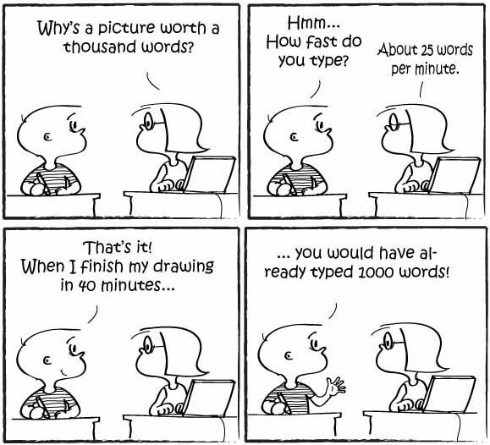
Drawings can have a lot of details
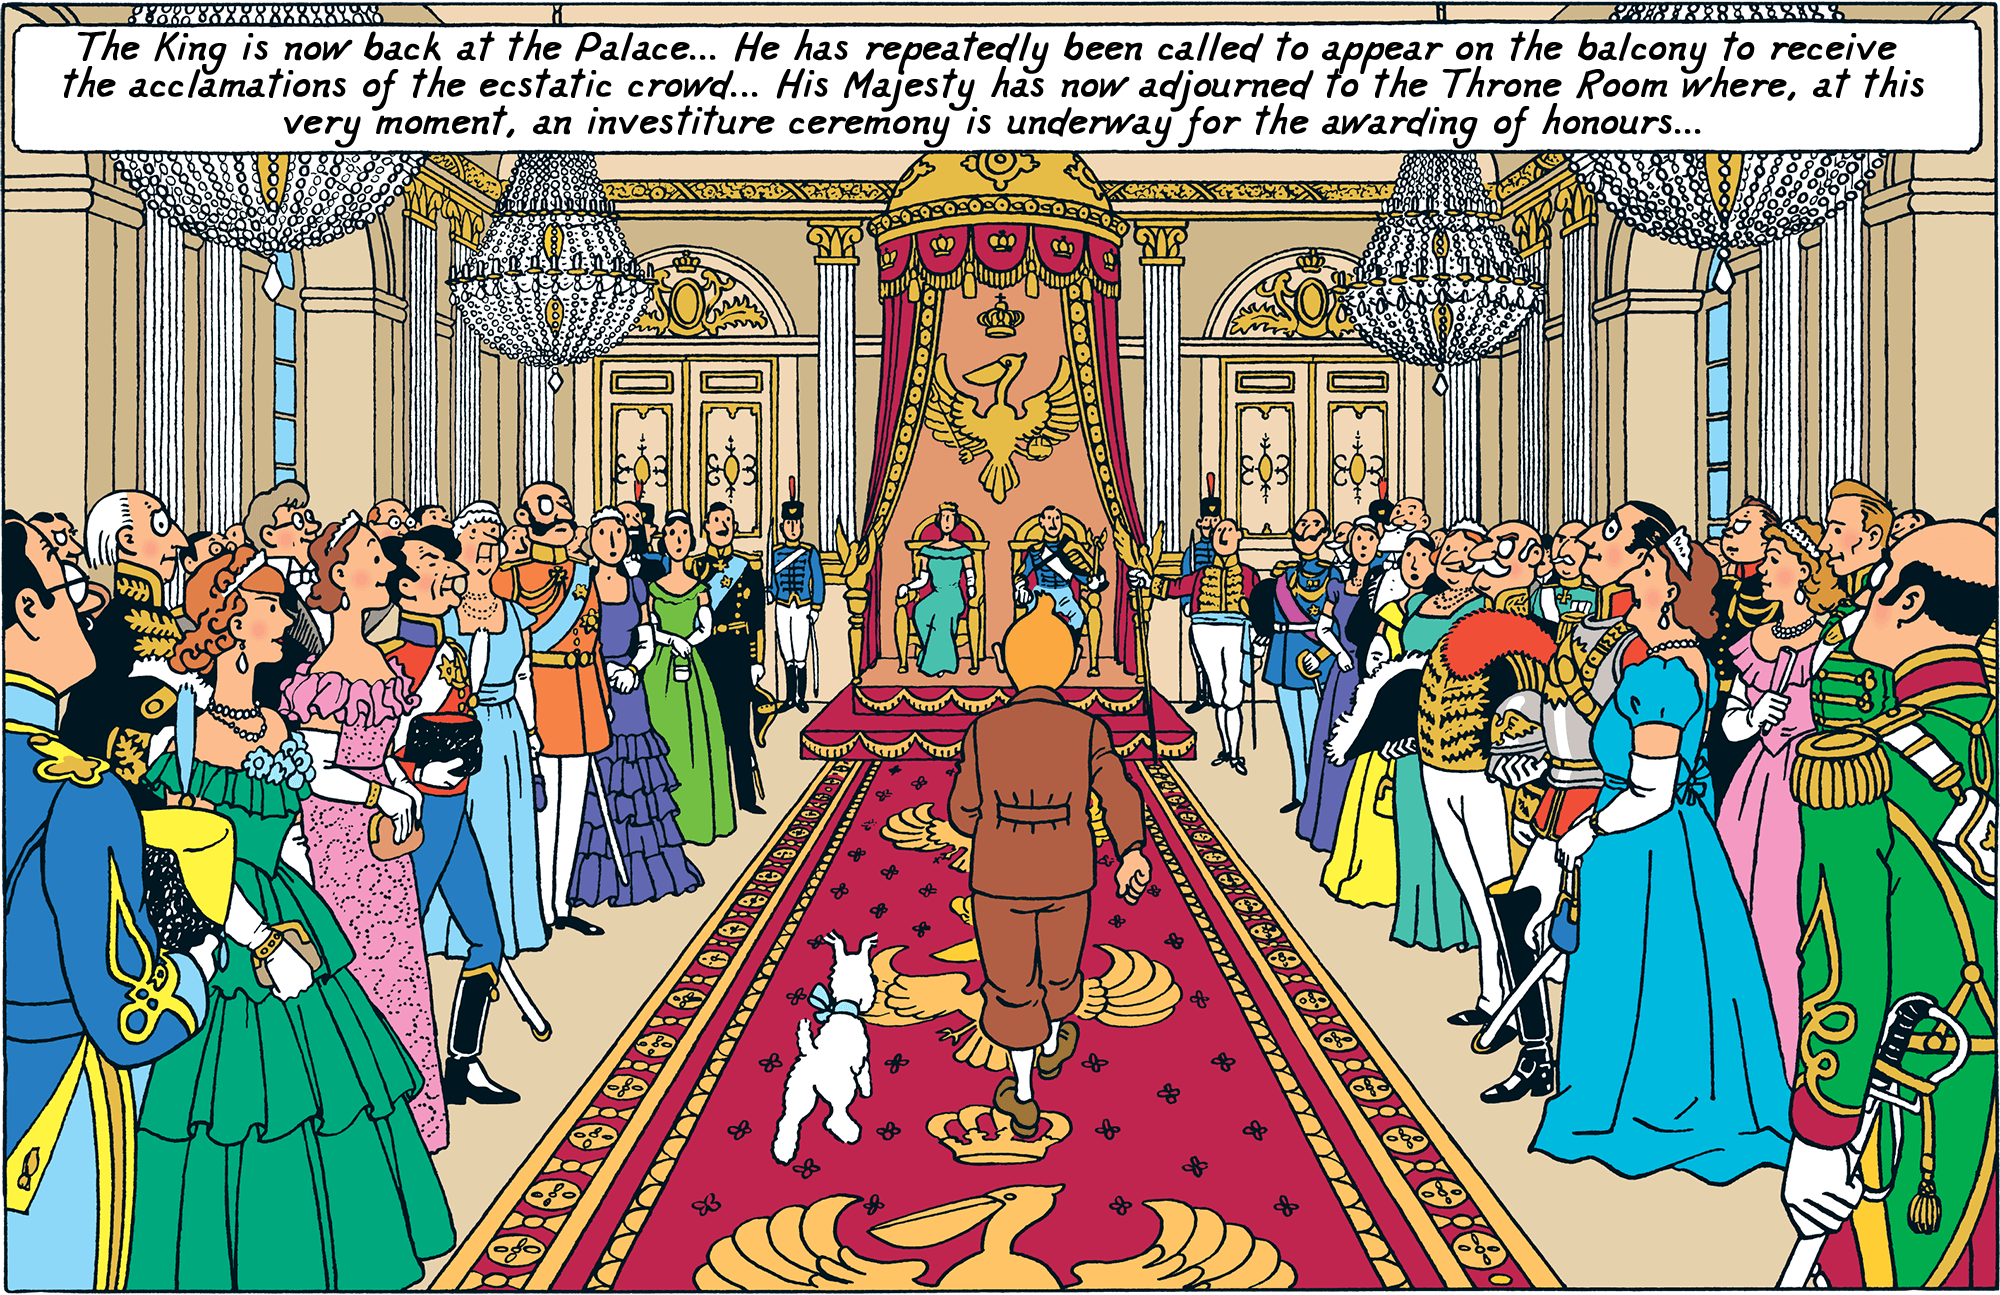
https://www.tintin.com/en/albums/king-ottokar-s-sceptre © Hergé - Moulinsart 2021
Or can have only the essential
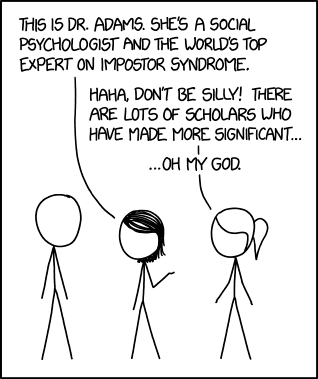
https://xkcd.com/1954/ This work is licensed under a Creative Commons Attribution-NonCommercial 2.5 License.
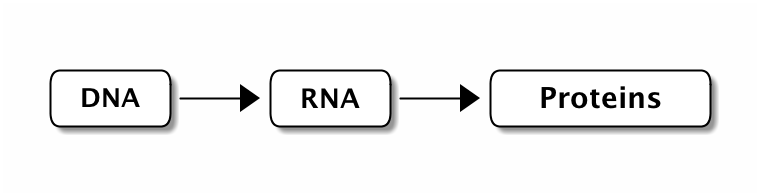
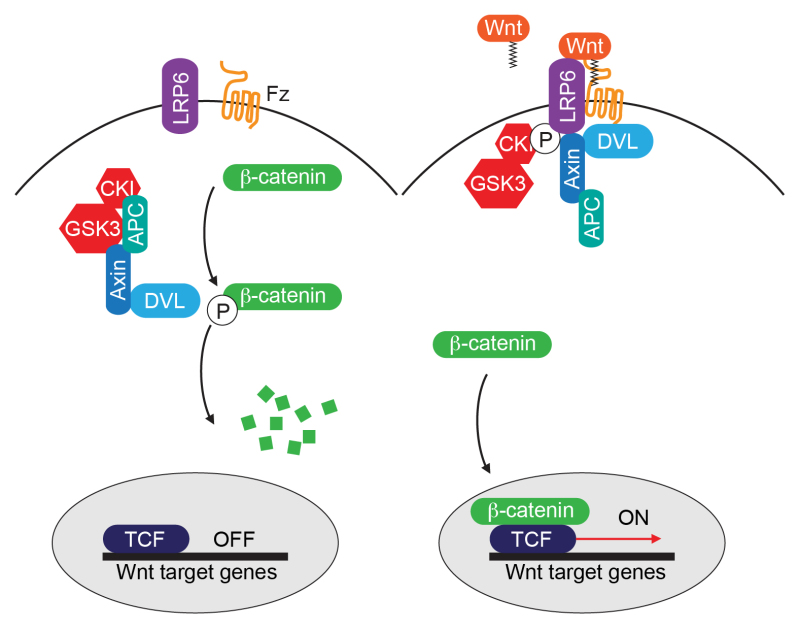
WNT pathway

Naito et al. Wnt signaling and aging-related heart disorders. doi:10.1161/CIRCRESAHA.110.223776
Another explanation of WNT pathway
Sawa H., Korswagen H. C. “Wnt signaling in C. elegans” (December 9, 2013), WormBook, doi:10.1895/wormbook.1.7.2, http://www.wormbook.org Copyright: © 2013 Hitoshi Sawa and Hendrik C. Korswagen.
Less, but better
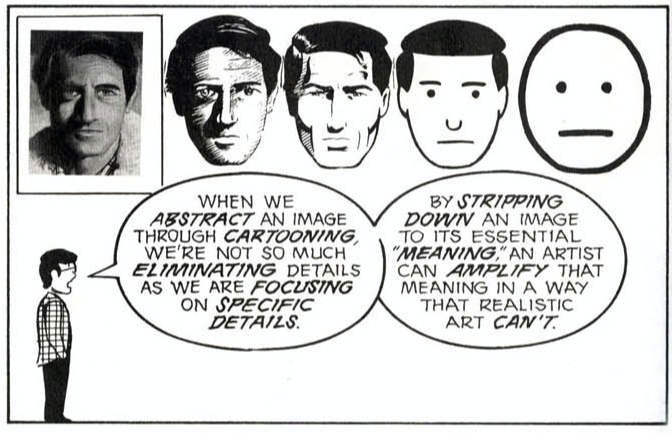
Scott McCloud (1993) “Understanding Comics: The Invisible Art”
Another picture from WNT pathway

Naito et al. Wnt signaling and aging-related heart disorders. doi:10.1161/CIRCRESAHA.110.223776
and this

and this also

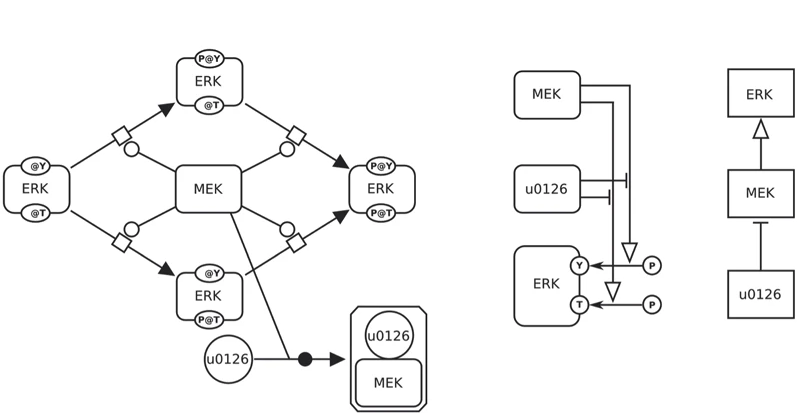
Example: Phosphorylation of ERK
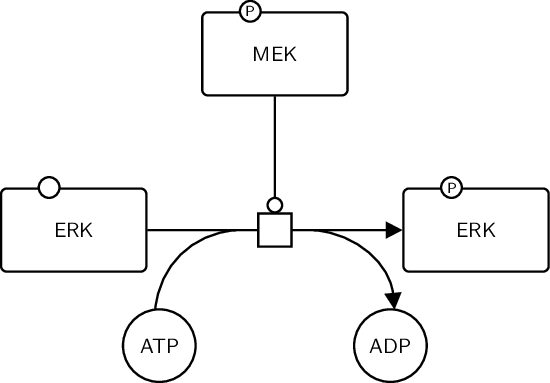
We can immediately understand the meaning
Three levels of description
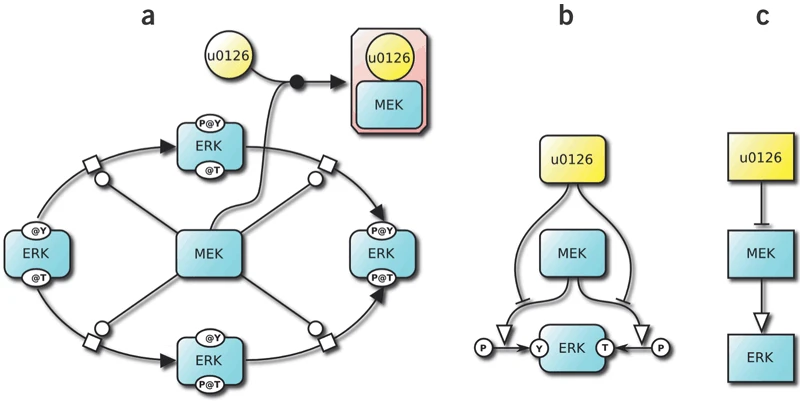
Same without colors
The End

https://dilbert.com/strip/2021-11-24 Dilbert by Scott Adams © 2021, Andrews McMeel Syndication