Class 1.1: How?
Systems Biology
Andrés Aravena, PhD
October 01, 2021
Interaction networks
Unfortunately, we do not have time to study all kinds of networks relevant in molecular biology
(at least, not in this course)
We will focus on interaction networks
That is, networks that can be built from gene expression data
Gene expression
In other words we will speak about
Transcription
We will learn to analyze gene expression, so we can design better experiments and achieve higher impact
Big plan
This course has basically three parts
- Finding differentially expressed genes
- evaluating differential expression
- using pre-normalized data
- statistical tests
- linear models
- Building interaction networks
- Normalizing gene expression data
Time to choose our schedule
Please fill this doodle
https://doodle.com/poll/g6n3ccsca3fnga6u?utm_source=poll&utm_medium=link
Measuring Gene Expression
More precisely, mRNA concentration
What is the question?
We want to know
- Which genes are being expressed
- How much of each gene is being expressed
- How does expression change
- In time
- Under different conditions
- Between strains/mutants/cell lines
The Big Assumption
Measuring protein concentration is hard
We assume that protein concentration is proportional to mRNA concentration
- Which genes are being transcribed
- How much of each gene is being transcribed
- How does transcription change
- In time
- Under different conditions
- Between strains/mutants/cell lines
How to measure mRNA concentration?
Basically
- qPCR
- Microarrays
- RNAseq
qPCR
If you have primers for each gene
- specific to each gene
- thermodynamically stable
- efficient
Raw data: CT value for each gene/condition
and CT value for calibration reference
Hybridization methods
Southern/Northern/Western blot can detect, but not quantify
(I think so. I’m not a biologist)
Instead, we have macro- and microarrays
Raw data: Light intensity (luminescence) in one or more wave length
This is measured in arbitrary units, and is a number between 0 and 65536
(that is, a 16-bits value)
RNAseq
mRNA is retro-transcribed and fragmented.
Fragments are sequenced. Reads are aligned to reference genome
Raw data: SAM/BAM file with location of each read in the reference genome
Processed data: Number of reads per gene, normalized by gene length
Data source: NCBI GEO
Gene Expression Omnibus
- Platforms
- Samples
- Series
- Data Set
- Profile
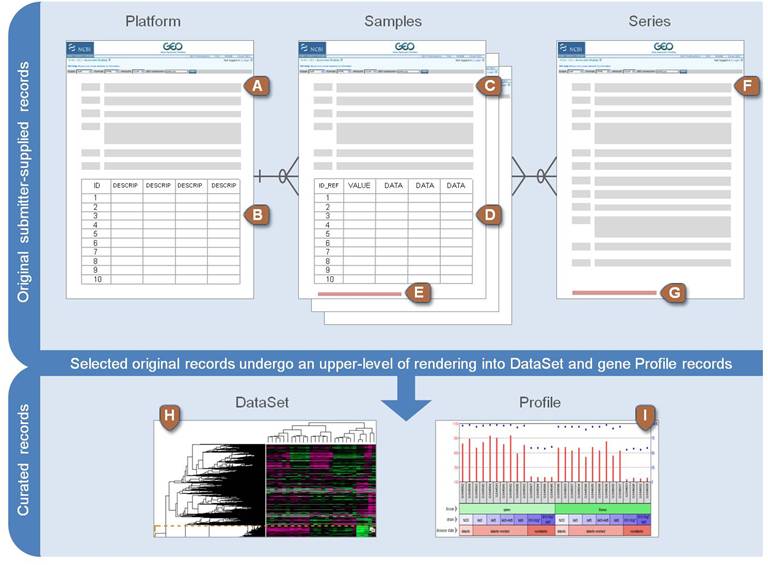
Relevant Objects in GEO
- GEO Platform
- Set of probes used in one or more experiment. Type of microarray slide, qPCR primers, including controls.
- GEO Samples
- a specific result of a single experiment. Raw RNA concentration for each probe in the platform
- GEO Series
- Set of Samples from a complete experiment. Includes technical and biological replicas
Relevant Objects in GEO
- GEO Datasets
- Sets of samples from different experiments that can be compared. For example, using the same platform
- GEO Profiles
- individual gene expression profiles assembled from GEO. Follows a single gene through several conditions
NCBI GEO data structure
Example
Let’s takea look at
GSE56896
Types of files
NCBI standard
- SOFT
- MINiML
- Series Matrix
Industry standard
- CEL (Affymetrix)
- GPR
- FASTQ (NGS)
- SAM/BAM (RNAseq)
Home exercise
These are optional, try at least one.
- Learn how to read these files in your computer
- They are usually compressed
- Do not use Word
- If you use Excel, be careful
- Learn how to get data from the European Database
- Bring your own data
Write a document (in English) explaining your results