Class 8: What is a 𝑝-value?
Methodology of Scientific Research
Andrés Aravena, PhD
2 Jun 2021
Patterns
Humans are good at finding patterns
Even when there is no pattern
Sometimes we overgeneralize
This is called “Pareidolia”
🙂
How do we know if the pattern is real?


This is what we want to learn today
Is the gene differentially expressed?
Let’s say we measured the differential expression of a gene several times
We want to know if the real differential expression is not zero
Is the gene differentially expressed?
We want to find a confidence interval for the real differential expression
And we want to see if 0 is in the interval
Assumption: Noise is Normal
We measure the biological signal and noise from the instrument
In general, after normalization, we can assume that the noise follows a normal distribution
If the real expression is \(μ\), then we measure \[X ∼ Normal(μ, σ^2)\]
The average is close to \(μ\)
For each gene we calculate the average \(\bar{X}\)
We know that the average will follow a normal \[\bar{X} ∼ Normal(μ, σ^2/n)\] Thus we can make an interval for \(μ\) \[\bar{X}-k⋅σ/\sqrt{n} ≤μ ≤ \bar{X}+k⋅σ/\sqrt{n}\] We have to choose \(k\) depending on the confidence level we aim
If we don’t know the distribution
We can always use Chebyshev’s Theorem
| k | Probability |
|---|---|
| 2 | ≥ 1-1/22 = 75% |
| 3 | ≥ 1-1/32 = 88.9% |
| 10 | ≥ 1-1/102 = 99% |
| 31.6 | ≥ 1-1/1000 = 99.9% |
| k | ≥ 1-1/k2 |
but these intervals are too wide to be useful
If the population has Normal distribution
In this case we know that the distribution is Normal, so
| k | Probability |
|---|---|
| 1.959964 | 95% |
| 2 | ≈ 95% |
| 2.5758293 | 99% |
| 3 | ≈ 99% |
(These values can be found in tables, or using the computer)
How to find 𝑘
Take the Normal curve with mean 0 and variance 1
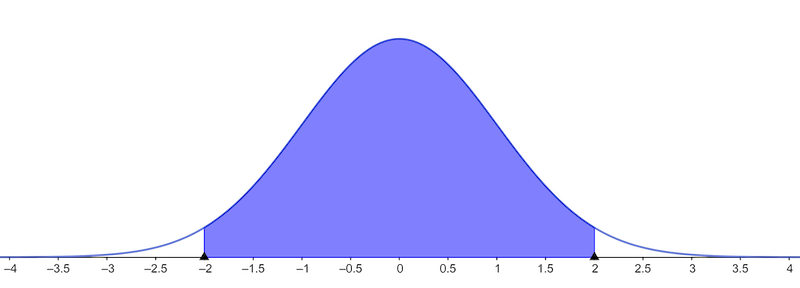
We want the blue area to be large.
So the white area should be small
Looking for 𝑘
If the blue area is 1-α, then the white area is α
The area of each white part is α/2.
We lool for the points 𝑘 giving areas α/2 and 1-α/2
Looking for 𝑘
For example, 95% confidence means that 1-α=0.95
Therefore α=0.05, and α/2=0.025
We look for 0.025 and 0.975 in the table
[1] -1.959964[1] 1.959964There is only one problem
We don’t know \(σ\)
Until now we have assumed that we knew the population standard deviation
But we do not
We can approximate it with the sample standard deviation
But we have to pay a cost
The price to pay: Student’s t distribution
This one depends on the degrees of freedom 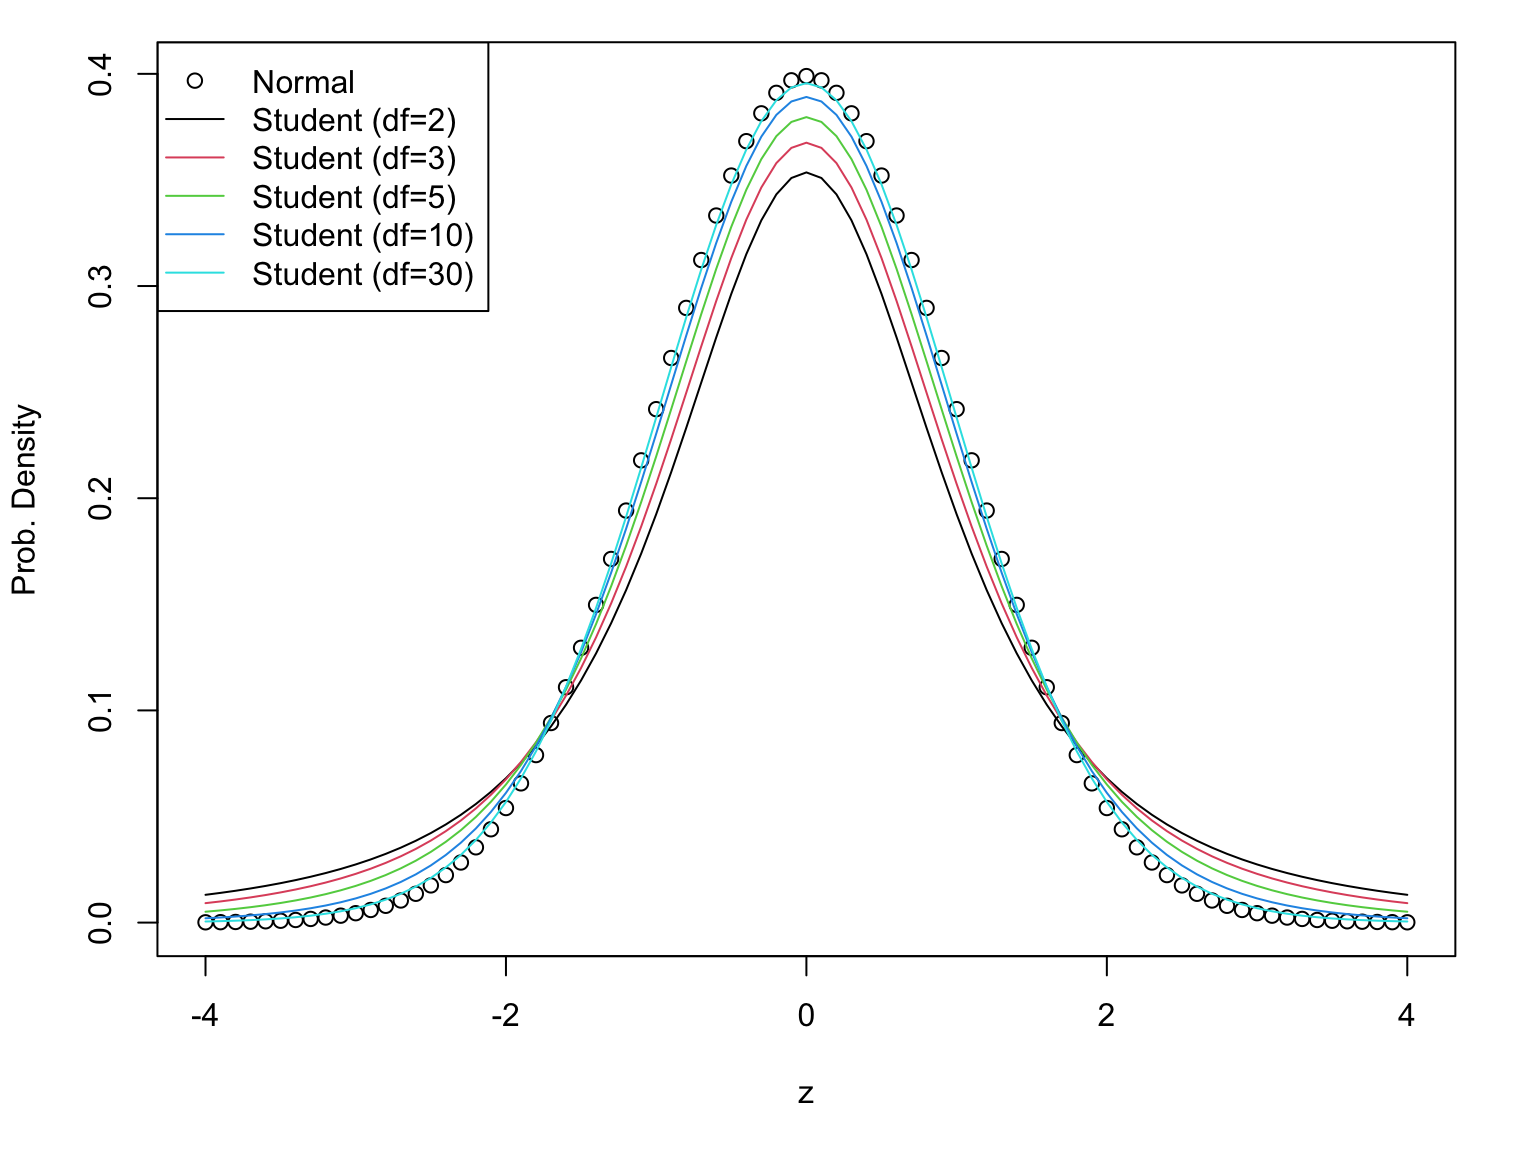
Student’s t has fat tails
The price to pay for not knowing the population variance is to use Student’s t instead of Normal distribution.
Intervals using Student’s t are wider (and less useful)
To avoid this problem, and get an useful results, we need large enough samples
Finding 𝑘
| k (df=2) | k (df=5) | k (df=10) | Normal | Probability |
|---|---|---|---|---|
| 4.3 | 2.57 | 2.23 | 1.96 | 95% |
| 9.92 | 4.03 | 3.17 | 2.58 | 99% |
| 31.6 | 6.87 | 4.59 | 3.29 | 99.9% |
Application
Here we have the measured differential gene expression of several genes
| Replica 1 | Replica 2 | Replica 3 |
|---|---|---|
| -0.6356720 | 0.5445543 | 0.5056405 |
| 0.9198619 | -0.6887110 | -0.2273942 |
| 1.1870043 | 1.0710029 | 1.3180957 |
| 0.1376069 | 1.7086511 | 1.1611300 |
| 0.8551033 | -1.0060231 | 0.4222059 |
There are three biological replicas for each gene
Case 1
The values of first gene are
[1] -0.6356720 0.5445543 0.5056405The mean is
[1] 0.1381743The standard deviation is
[1] 0.6704529Interval for Case 1
We have 𝑛=3 values, and we are estimating 1 value (the mean)
Thus, we have 3-1=2 degrees of freedom
The t distribution for 95% and 2 degrees of freedom is
[1] 4.302653Thus, the 95%-confidence interval for the expression is
[1] -2.746552 3.022900The interval contains 0, so it seems that the gene is not differentially expressed
Case 2
The values of first gene are
[1] 1.187004 1.071003 1.318096The mean is
[1] 1.192034The standard deviation is
[1] 0.1236232Interval for Case 2
The t distribution for 95% and 2 degrees of freedom is
[1] 4.302653Thus, the 95%-confidence interval for the expression is
[1] 0.6601268 1.7239418The interval does not contain 0, so it seems that the gene is differentially expressed
Redoing at 99% confidence
The t distribution for 99% and 2 degrees of freedom is
[1] 9.924843Thus, the 99%-confidence interval for the expression is
[1] -0.03490616 2.41897477Now the interval contains 0, so it seems that the gene is not differentially expressed
What is the “good” confidence level?
Asking the inverse question
In Case 2 we have different results depending on the confidence level
One can ask “What is the largest confidence level that will not include 0?”
In other words, what is the smallest α that will not include 0?
That is the 𝑝-value
Calculating the 𝑝-value
The interval can be written as \[-k⋅sd(X)/\sqrt{n} ≤ \bar{X} - μ ≤ k⋅sd(X)/\sqrt{n}\] In the limit case we have \[\bar{X}-μ = k⋅sd(X)/\sqrt{n}\] so \[k=\frac{\bar{X}-μ}{sd(X)/\sqrt{n}}\]
Looking for 𝑘
In this case we have n=3, mean=1.192 and sd=0.124, so \[k=\frac{1.192}{0.124/\sqrt{3}} = 5.567\] We use this value to find α in the table
[1] 0.01539187The best confidence level is 1-α=0.985