Class 7: Central Limit Theorem
Methodology of Scientific Research
Andrés Aravena, PhD
5 May 2021
Homework Answers
How many people to interview?
If you do not have access to the age distribution, but you know only the standard deviation
- How many people you need to interview to estimate the average age of the Turkish population with a margin of error of 5 years?
- … of 1 year?
- … of 1 month?
- What is the probability that the real value is inside the intervals you have found?
sample mean v/s population mean
We are looking for population mean \(𝔼X\)
We know the population variance \(𝕍X\)
We interview \(n\) people and calculate \(\bar{𝐗}\)
A confidence interval
The population average is probably in the interval \[\left[\bar{𝐗}-c\sqrt{𝕍(X)/n}, \bar{𝐗}+c\sqrt{𝕍(X)/n}\right]\]
Using Chebyshev’s inequality, we know that the probability is at least \(1-1/c^2\)
Interval width
We want the interval width to be less than 5 (or 1, or 1/12) years
Let’s say \[y≤2c\sqrt{𝕍(X)/n}\] therefore \[n≥4c^2𝕍(X)/y^2\]
Evaluating with known values
Variance 𝕍(X) is 473.23 yr2
| c | Prob | 5 yr | 1 yr | 1 month |
|---|---|---|---|---|
| 2 | 75% | 1,515 | 7,572 | 90,860 |
| 3 | 89% | 3,408 | 17,037 | 204,435 |
| 5 | 96% | 9,465 | 47,323 | 567,874 |
| 10 | 99% | 37,859 | 189,292 | 2,271,496 |
Insurance
Homework Question 1
Statement
A company wants to offer insurance to protect against the economic damage of COVID-19.
- If a person takes the insurance, they pay 𝑥.
- If they get COVID in the next year , then they got paid a fixed amount 𝑦
- this happens with probability 𝑝
- After one year, the company will have a net result 𝑅 corresponding to income minus expenses.
- Since expenses depend on how many people get sick, 𝑅 is a random variable.
Questions
- What is the expected value of the net result 𝑅?
- What are the variance and standard deviation of the net result 𝑅?
- What is the interval that contains the real net result 𝑅 with 99% probability?
Calculating net result 𝑅
We have \(n\) people paying, and \(𝑆\) people getting sick. The result is \[R=nx-𝑆y\] For our analysis, \(n, x\) and \(y\) are fixed, but \(𝑆\) is a random variable. Thus \(R\) is a random variable.
We want to know \(𝔼(R)\)
How can we calculate it?
Expected value of 𝑅
Using the definition, we have \[𝔼(R)=𝔼(nx-sy)=nx-𝔼(𝑆)y\] So we need to calculate \(𝔼(𝑆)\)
What do we know about \(𝑆\)?
𝑆 is the number of sick people
There are \(n\) people, each one can get sick with probability \(p\)
Each person is a “coin” with probability \(p\)
Thus \(𝑆\) is a sum of coins
𝑆 follows a Binomial distribution
Assuming that each person gets sick independently, then \[𝑆 \sim Binom(n,p)\] Therefore, we immediately know that \[𝔼(𝑆)=np\qquad 𝕍(𝑆)=np(1-p)\]
Answers
- What is the expected value of the net result 𝑅? \[𝔼(R)=nx-𝔼(𝑆)y=nx-npy\]
- What are the variance and standard deviation of the net result 𝑅? \[𝕍(R)=𝕍(nx)+𝕍(-𝑆y)=0+ 𝕍(𝑆)y^2 =np(1-p)y^2\]
- What is the interval that contains the real net result 𝑅 with 99% probability?
Confidence interval
After one year, the result \(R\) will be somewhere \[\left[𝔼(R)-c\sqrt{𝕍(R)}, 𝔼(R)+c\sqrt{𝕍(R)}\right]\] That is \[\left[nx-npy-cy\sqrt{np(1-p)}, nx-npy+cy\sqrt{np(1-p)}\right]\]
How do we choose \(x\) and \(y\)?
How not to get broke
We want \(R≥0,\) so the lower limit of the interval must be positive \[nx-npy-cy\sqrt{npq}≥0\] thus \[\frac{x}{y}≥p+c\sqrt{\frac{p(1-p)}{n}}\]
With numbers
Assuming \(p=0.1,\) then \(x/y\) must be at least
| c | Prob | 10 | 100 | 1000 | 10000 | 100000 |
|---|---|---|---|---|---|---|
| 2 | 75% | 0.29 | 0.16 | 0.12 | 0.11 | 0.10 |
| 3 | 89% | 0.38 | 0.19 | 0.13 | 0.11 | 0.10 |
| 5 | 96% | 0.57 | 0.25 | 0.15 | 0.12 | 0.10 |
| 10 | 99% | 1.05 | 0.40 | 0.19 | 0.13 | 0.11 |
Can we do better?
Chebyshev is pessimistic
We used Chebyshev formula, which does not need any hypothesis
But we have more information. We know that \(𝑆\) is a Binomial random variable
Therefore we can make better confidence intervals
Calculating ℙ(𝑆=x)
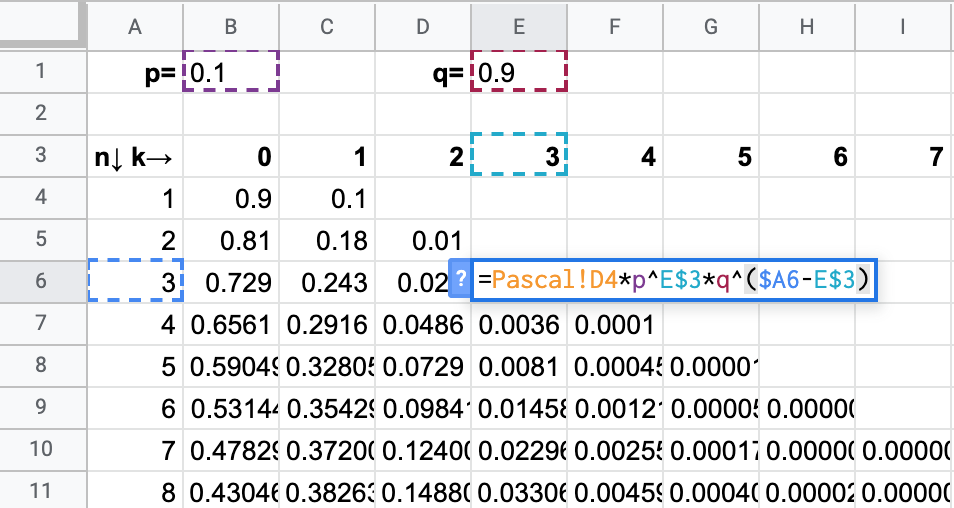
We know that \[ℙ(𝑆=k|n\text{ in total})=\binom{n}{k} p^k(1-p)^{n-k}\] We can calculate \(\binom{n}{k}\) using Pascal’s triangle, even in Excel
Binomial coefficient in Excel
Pascal’s Triangle 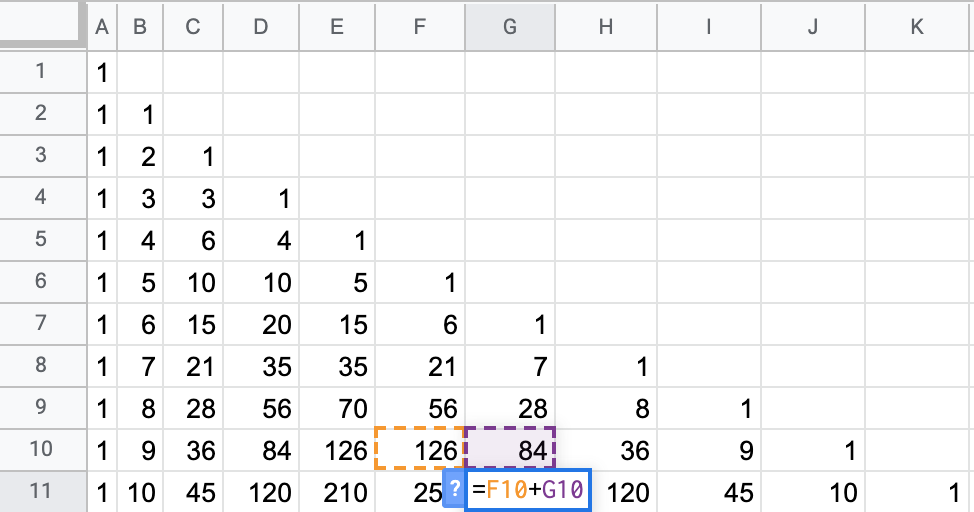
Binomial distribution in Excel
Binomial distribution visually

Making the interval for 𝑆

\[ℙ(𝑆≤k)=\sum_{j=0}^k ℙ(𝑆=j)\]
Use better tools
Good tools include functions to calculate the usual distributions
In Excel we have BINOM.DIST(k, n, p, cumulative)
In R we have pbinom() and dbinom()
What happens when 𝑛 is big?
A simple model
Now we have a coin 𝑋 with two possible outcomes: +1 and -1
To make life easy, we assume 𝑝=0.5
What are the expected value and variance of X ?
Throw the coin 𝑛 times
We throw the coin 𝑛 times, and we calculate 𝑌, the sum of all 𝑋 \[Y=\sum_{i=1}^𝑛 X_i\]
What are the expected value and variance of 𝑌 ?
It is easy to see that
- 𝑌 is basically a Binomial random variable
- 𝔼𝑌 = 0, because 𝔼𝑋 = 0
- 𝕍𝑌 = 𝑁, because 𝕍𝑋 = 1
Fix the variance to 1
Now consider \(Z_n=Y/\sqrt{𝑛}\)
It is easy to see that \(𝔼Z_n = 0\) and \(𝕍Z_n = 1\) independent of 𝑛
The possible values of \(Z_n\) are not integers. Not even rationals
What happens with \(Z_n\) when 𝑛 is really big?
Central limit theorem
When \(n→∞,\) the distribution of \(Z_n=∑ X/\sqrt{𝑛}\) will converge toa Normal distribution \[\lim_{n→∞} Z_n ∼ Normal(0,1)\]
More in general
If \(X_i\) is a set of independent, identically distributed random variables, with expected value \[𝔼X_i=μ\quad\text{for all }i\] and variance \[𝕍X_i=σ^2\quad\text{for all }i\] then, when \(n\) is large \[\lim_{n→∞} \frac{\sum_i X_i-μ}{σ\sqrt{𝑛}} ∼ Normal(0,1)\]
In other words
If \(X_i\) is a set of independent, identically distributed random variables, with expected value \[𝔼X_i=μ\quad\text{for all }i\] and variance \[𝕍X_i=σ^2\quad\text{for all }i\] then, when \(n\) is large \[\lim_{n→∞} \frac{\sum_i X_i-μ}{\sqrt{𝑛}} ∼ Normal(0, σ^2)\]
This is why Normal distributions are important
Noise is usually Normal
- Thermal noise is the sum of many small vibrations in all directions
- they sum and usually cancel each other
- Phenotype depends on several genetic conditions
- Height, weight and similar attributes depend on the combination of several attributes
It does not always work
- Not all combined effects are sums
- some effects are multiplicative
- Some effects may not have finite variace
- sometimes variance is infinite
- Not all effects are independent
- this is the most critical issue