Class 2: Statistical significance
Methodology of Scientific Research
Andrés Aravena, PhD
24 March 2021
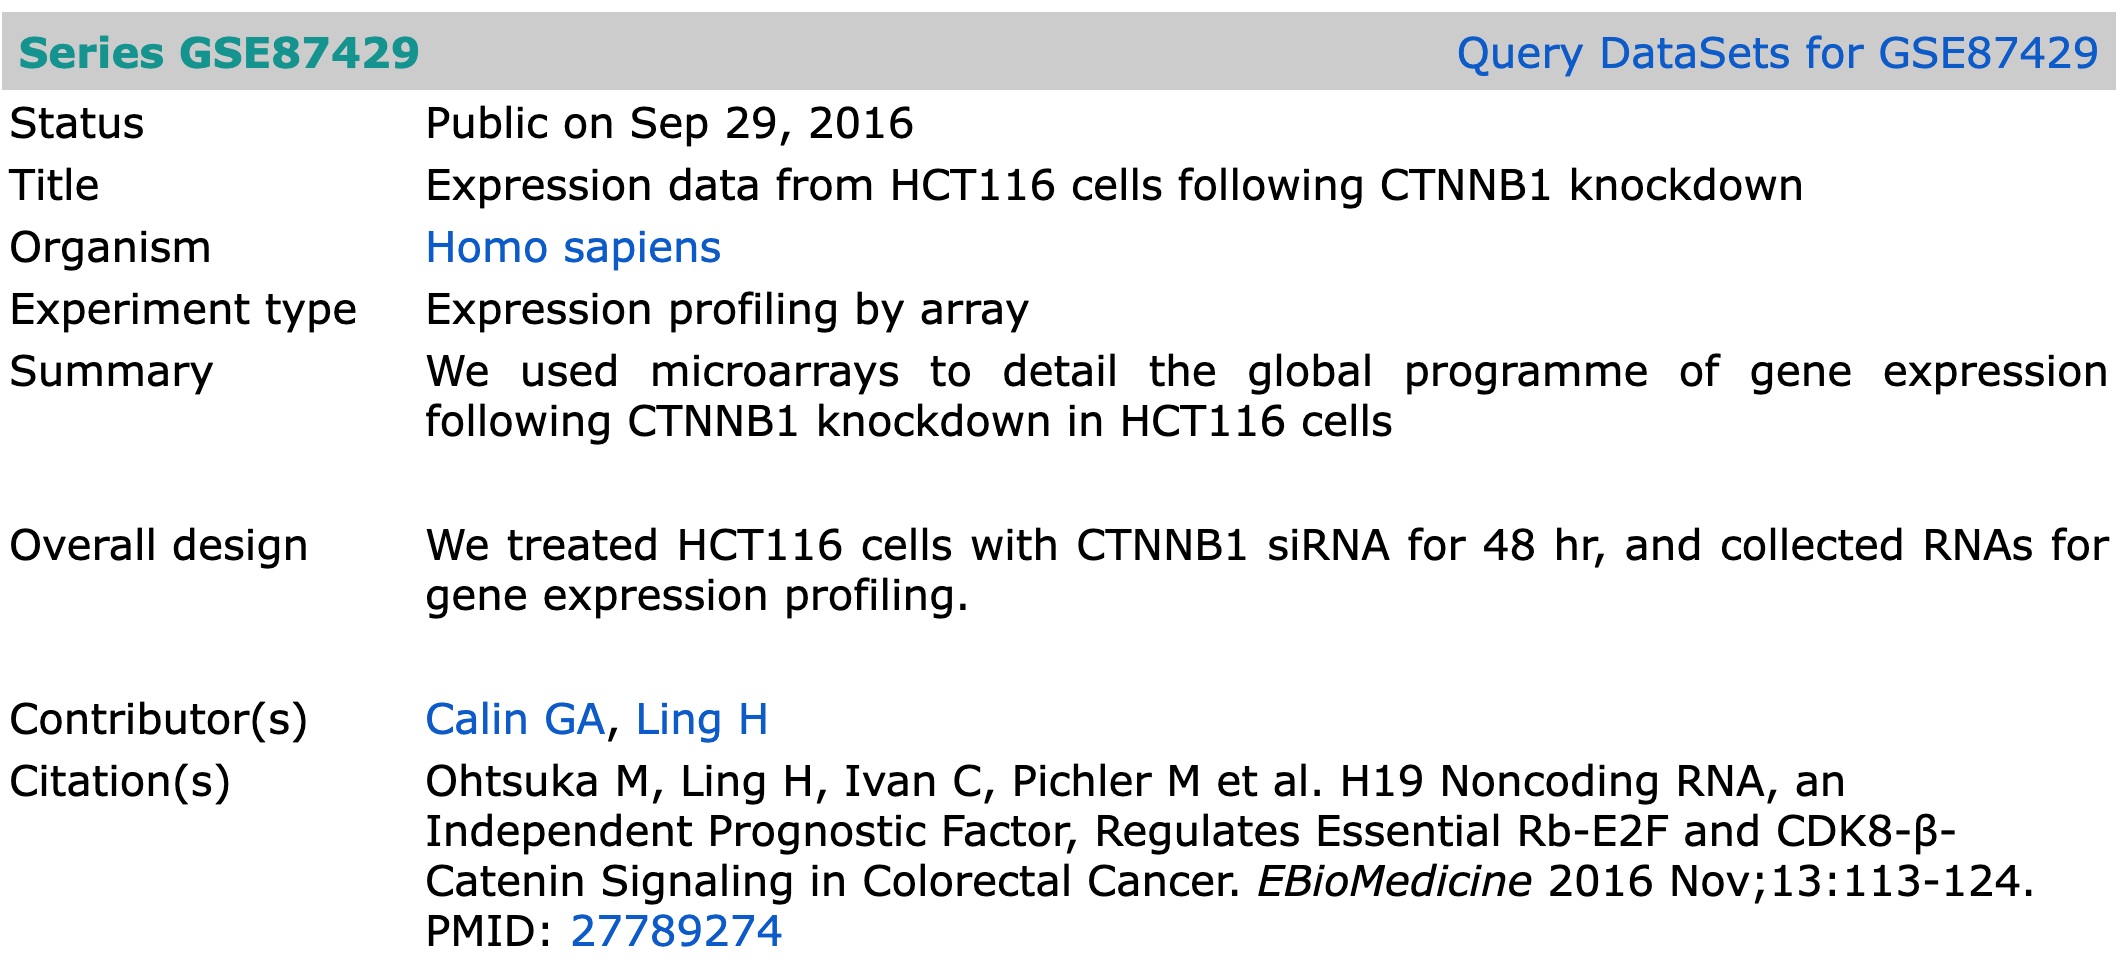
Using GEO
![]()
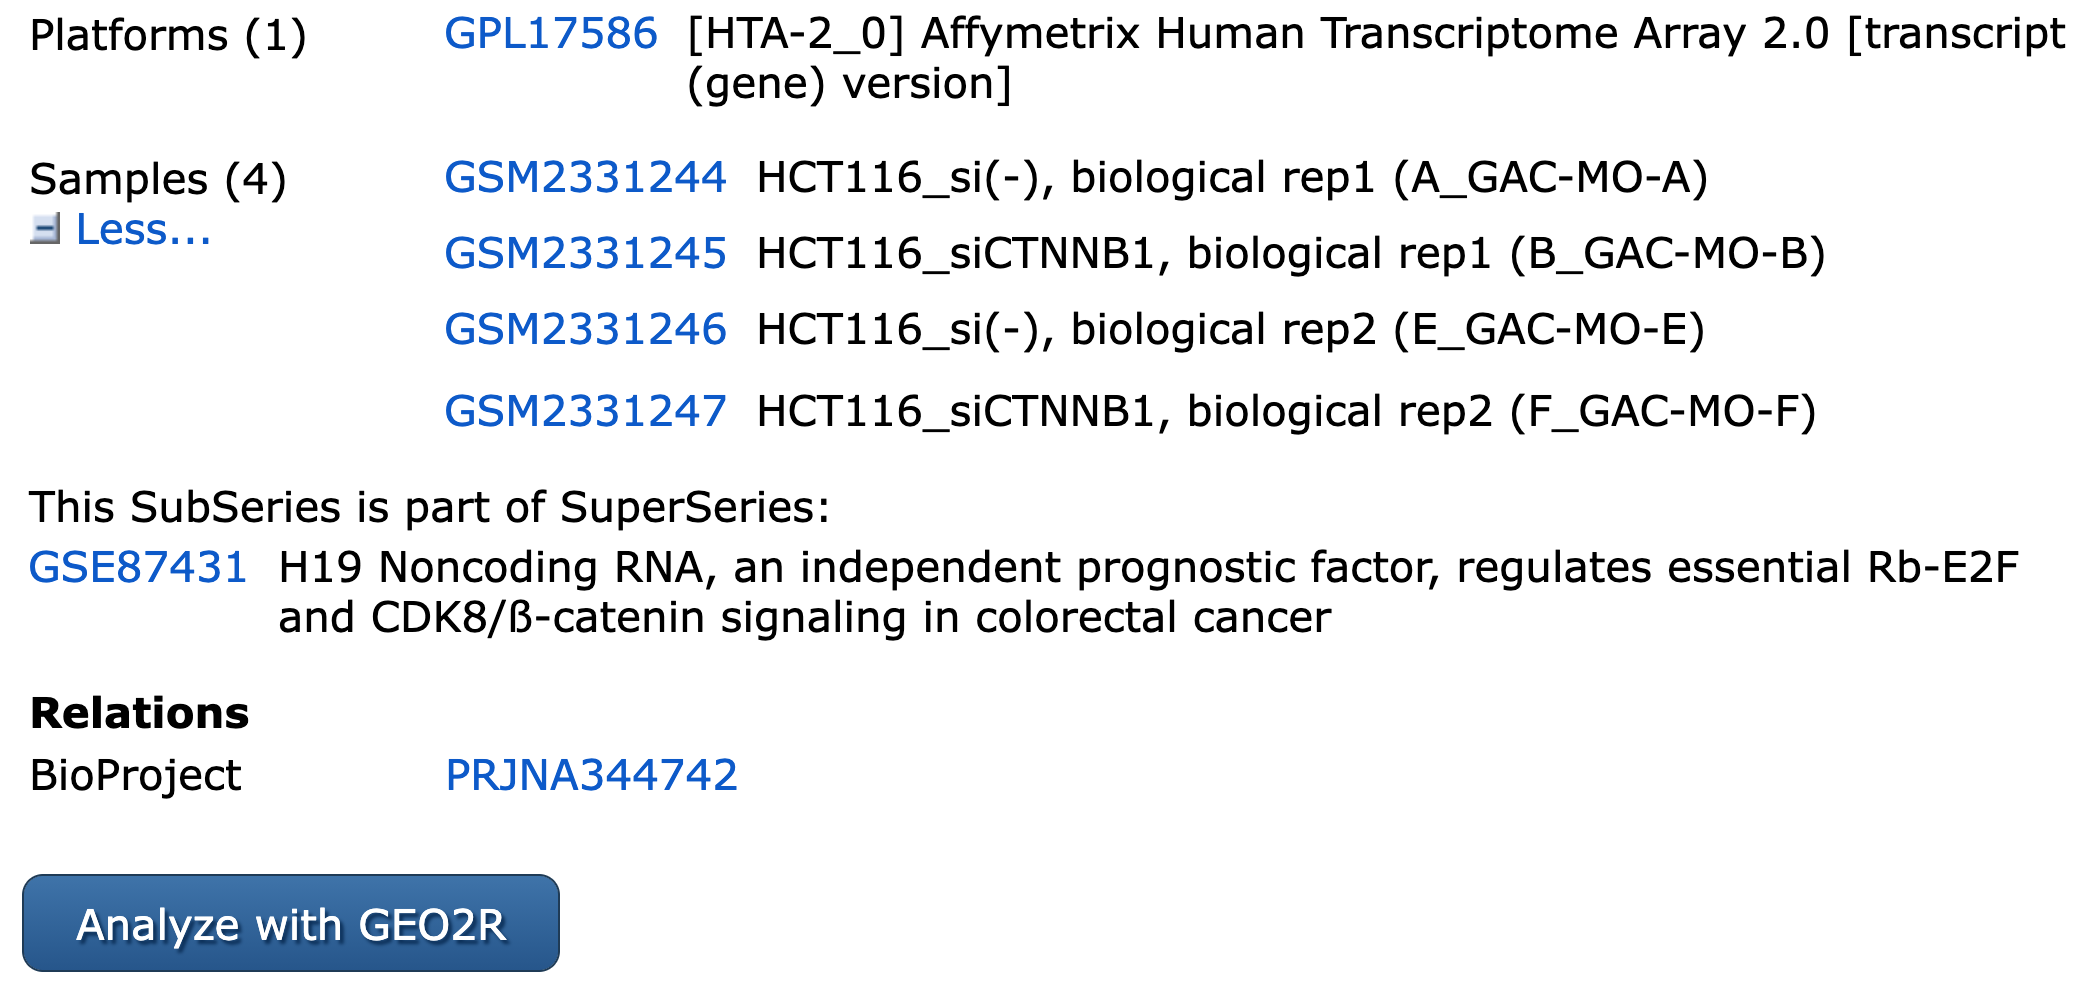
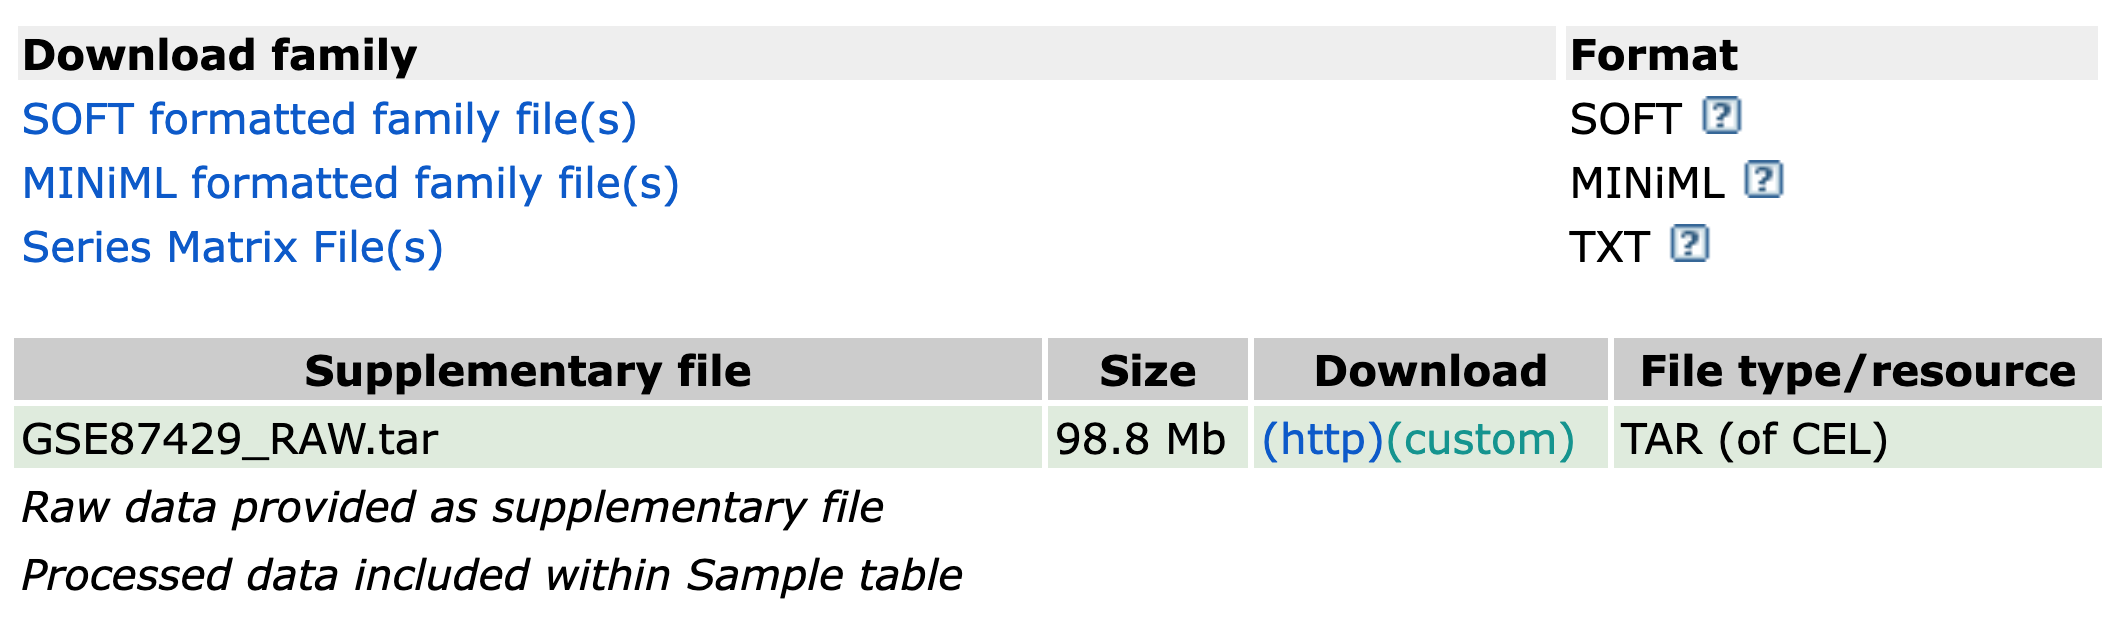
Data to analyze
![]()
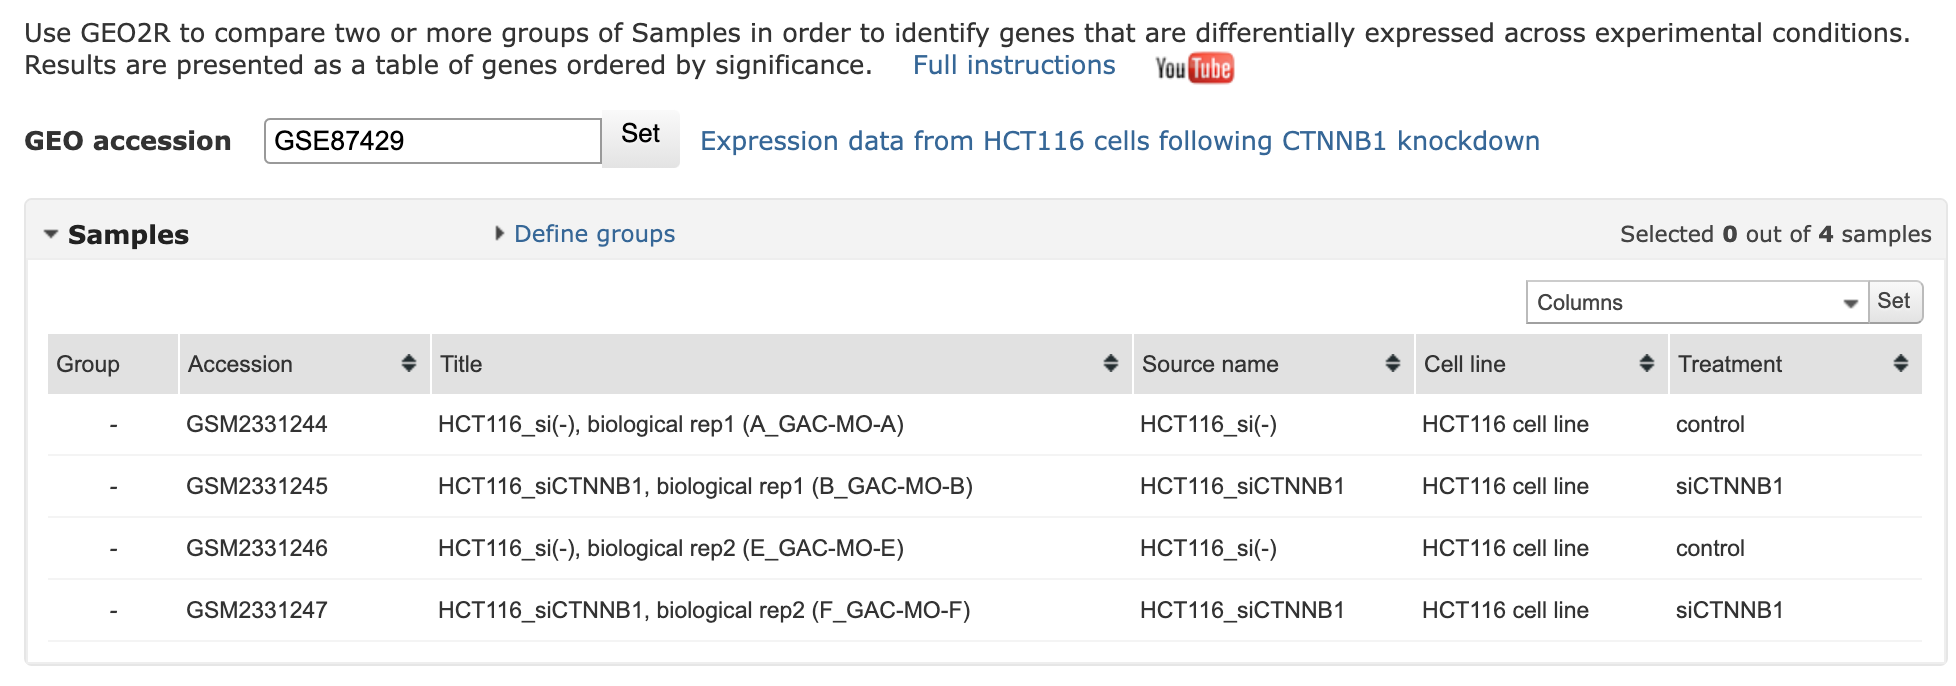
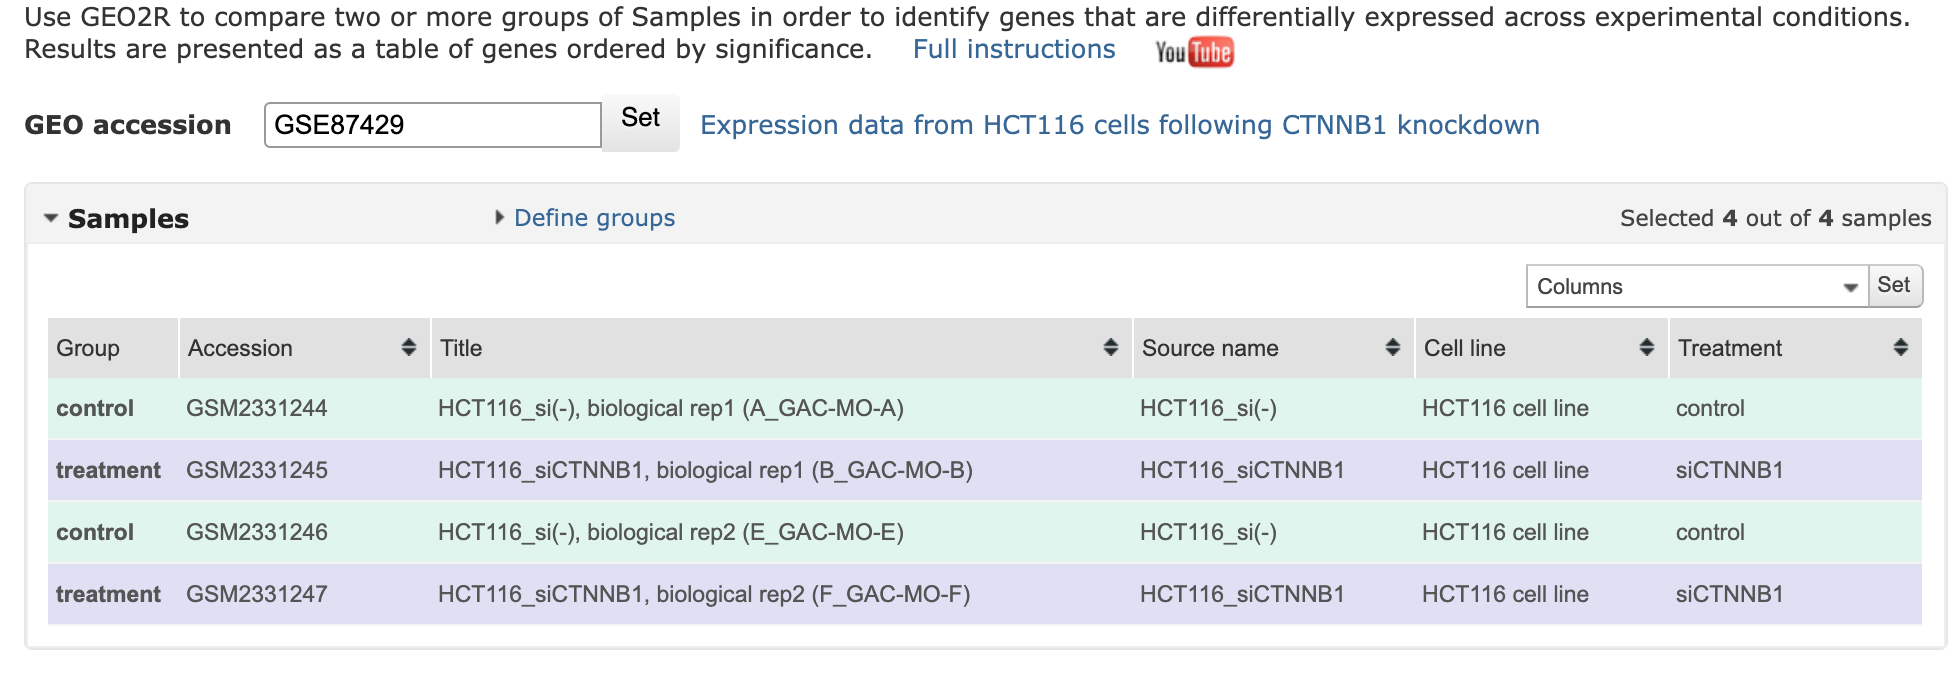
Using GEO2R
![]()
control vs treatment
![]()
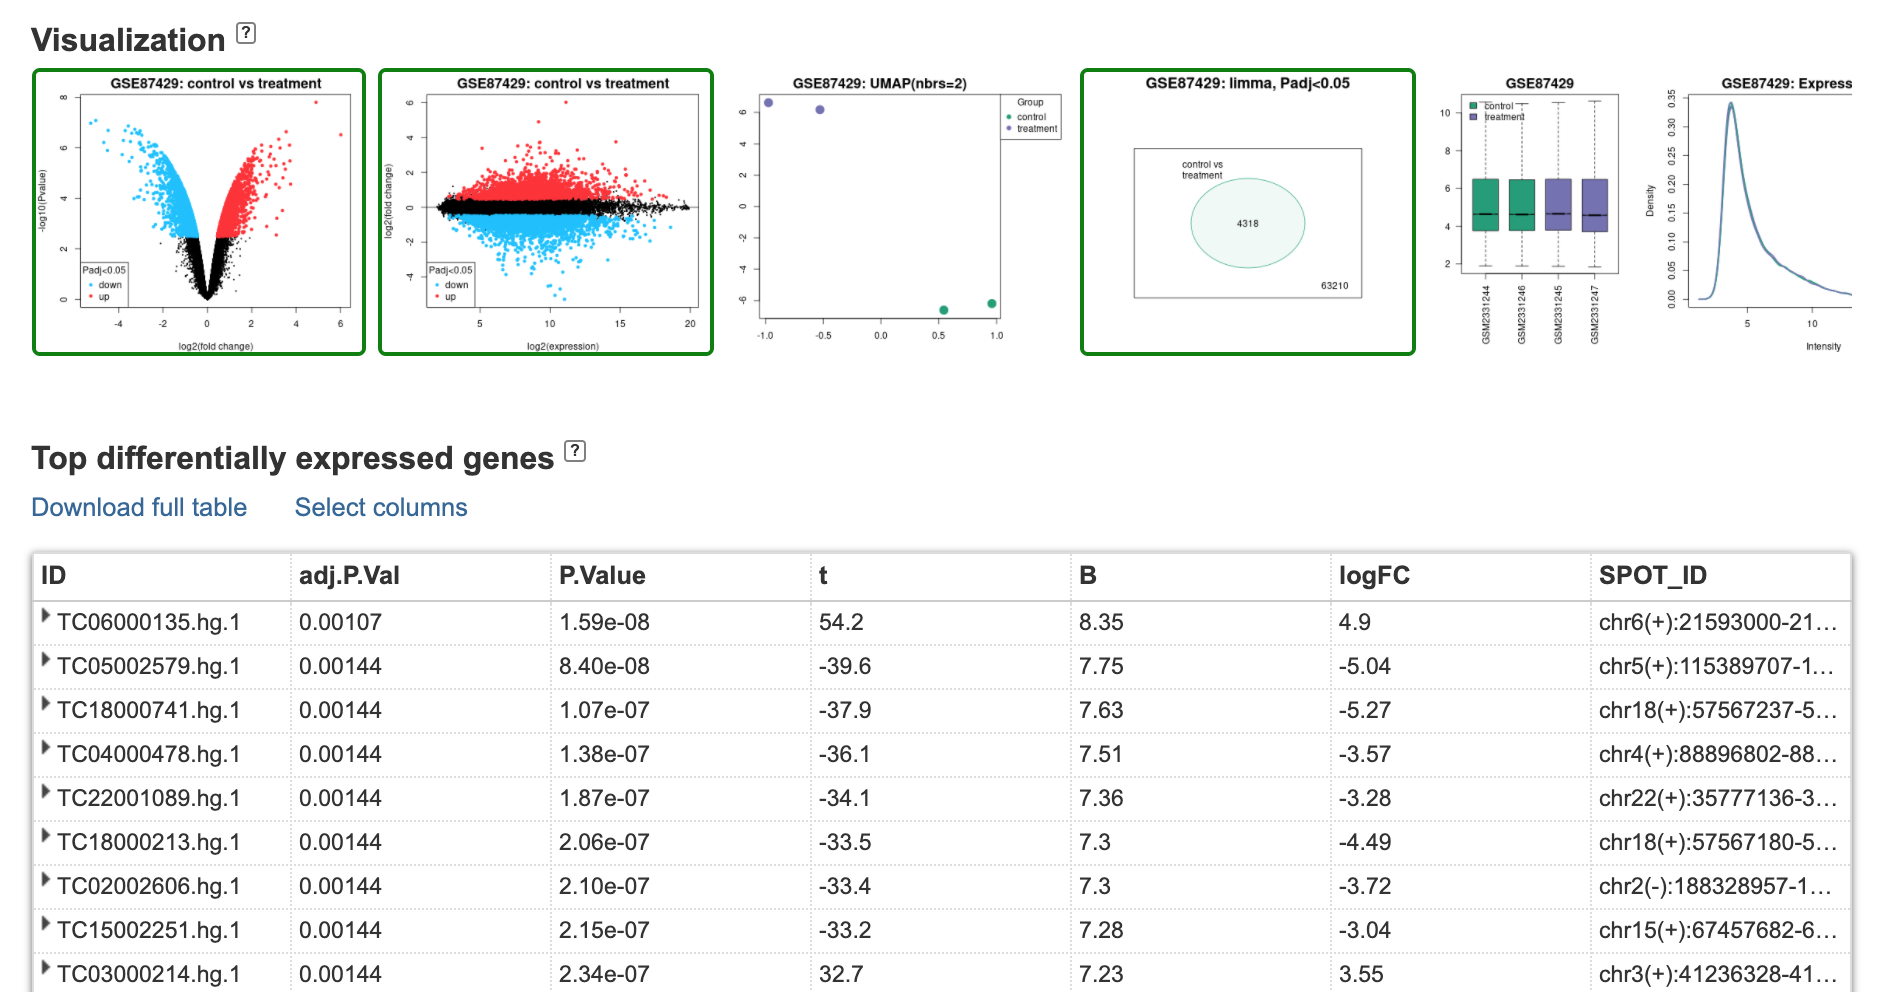
Results
![]()
Expression and Log
Raw data is light intensity (luminescence) for Control and Treatment \[C, T\]
We work with the logarithm (base 2) of these values \[LC=\log_2(C)\\LT=\log_2(T)\]
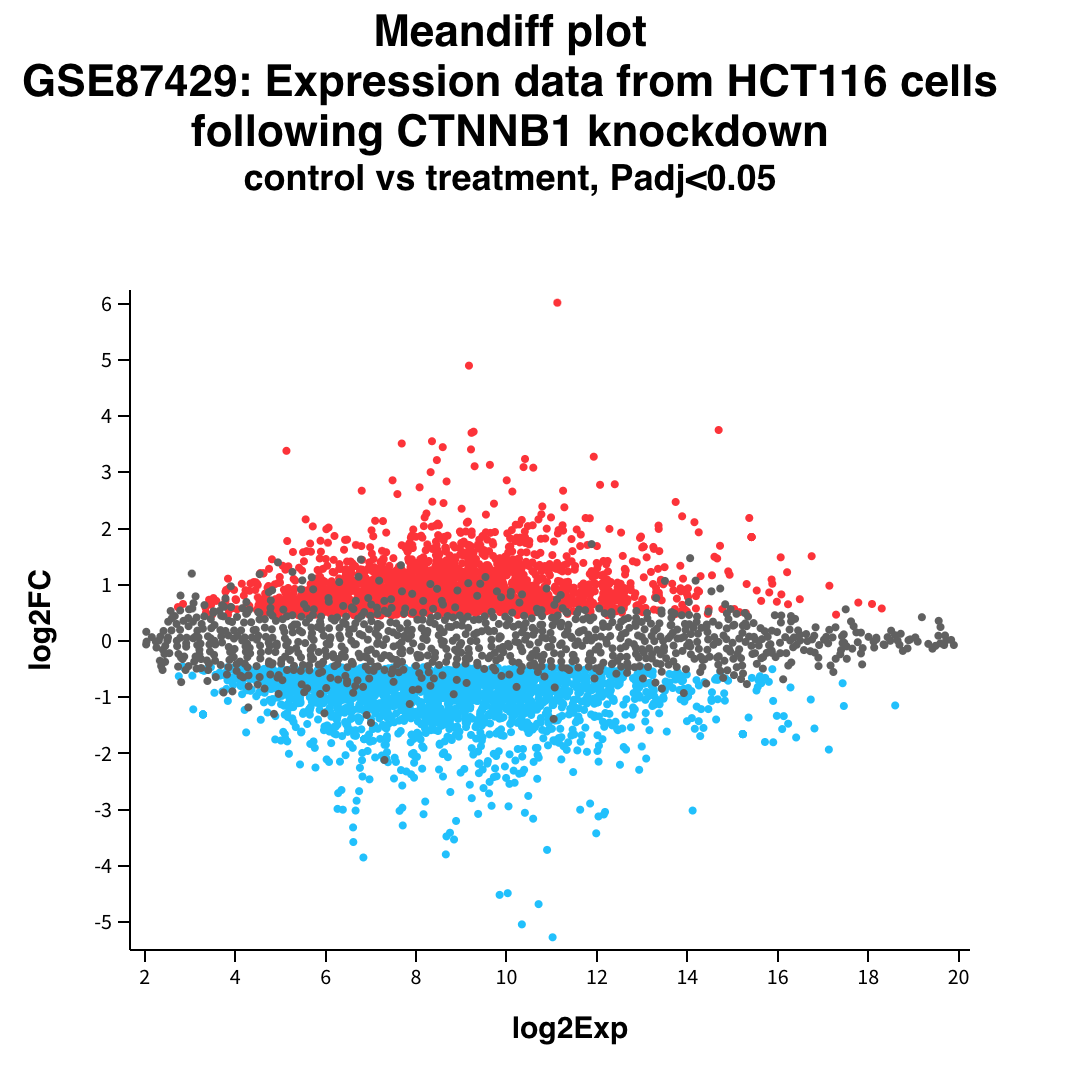
Average Expression & Fold Change
Then Average expression is \[AvgExp = \frac{LT + LC}{2}\] and Fold change is \[logFC = LT - LC=\log_2\left(\frac{T}{C}\right)\]
Expression v/s Fold Change
![]()
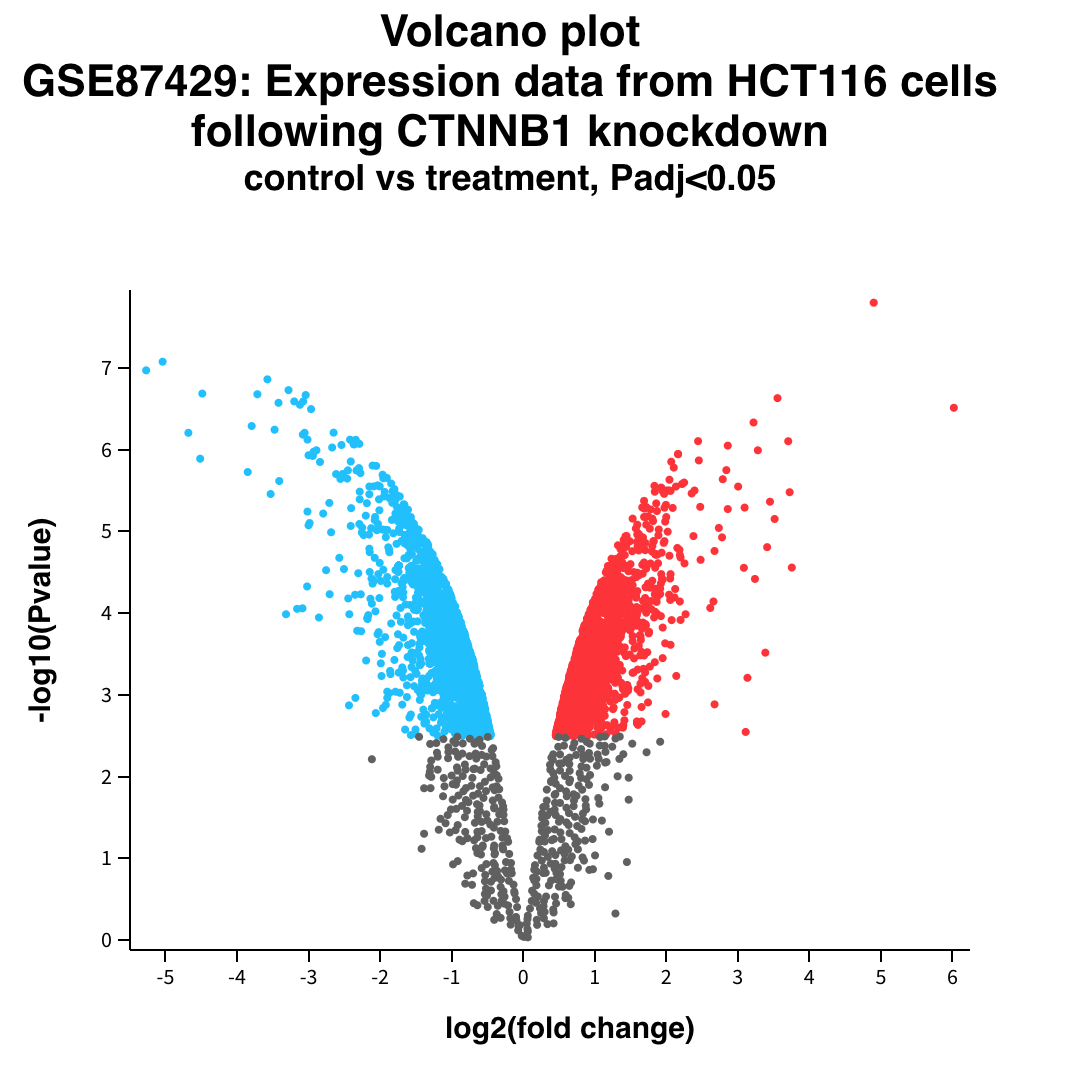
Volcano plot
![]()
Hypothesis test
Classical statistics. We have two scenarios, called hypothesis
- H0: Nothing happens
- H1: Something happens
But our experiment cannot tell us directly which one is true
What we measure
Every experiment has 4 contributions
- Biology (or Nature)
- Natural variability
- Instrument
- Noise
Example: Black and white horses
We want to test the hypothesis “black horses are taller or shorter than white horses”
- We want to compare average height of black horses v/s white horses
- Each particular horse can be short or tall
- We use a measuring tape
![]()
- Horses do not stay put
Experiments are random variables
We may have bad luck. Maybe black and white horses have the same average height, but
- we got only the small black horses and the tall white ones
- the horses move a lot and we cannot measure the correct values
Therefore, we cannot be 100% sure that our results correspond to reality
But we can have a degree of confidence that we are not far away
p-value and null hypothesis
In terms of hypothesis test, we have
- H0: the real averages are the same. We only see variability and noise.
- H1: the real averages are different. The measurements are too different to be only noise.
The p-value is the probability of observing the experimental data \(X\), assuming that H0 is true \[ℙ(X|H_0)\]
Is this what we want?
Notice that \[ℙ(X|H_0)≠ℙ(H_0|X)\] In other words, the p-value is not the probability that the null hypothesis is true, given the experimental result
Ideally we will like to know this last probability, but it is hard to do so
Calculating the probability
![]()
Calculating the probability
Under the null hypothesis, the height difference is 0
If we can also assume that the noise and variability follow a Normal distribution \(N(0,σ^2),\) we have
![]()
Student’s t-test
We have another problem. We do not know σ²
A clever biologist found a solution
We measure the variance in our data and we use it
But we have to pay a price: We have less confidence
Student’s distribution
![]()
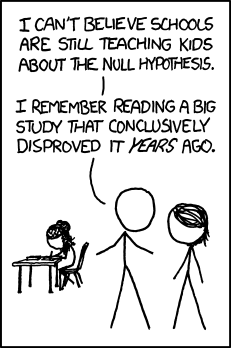
When is it significant?
![Joke]()
When is it significant?
Traditionally, 5% and 1% are used as p-value thresholds
But there is nothing to decide that these are good values
Indeed, in Gene Expression, these value are usually too big
The problem with multiple tests
![]()
Multiple test correction
There are several approaches
- Family Wise Error Rate control (Bonferroni)
- False Discovery Rate control (Hochberg)
- Others
The basic difference is the trade-off between False Positives and False Negatives
Two ways of being wrong
In every hypothesis test, we can be wrong in two ways
- Type 1: False positive
- putting innocents in the jail
- Type 2: False negatives
Usually improving one means worsening of the other
How does FWER work
Family Wise Error Rate multiplies each p-value by the number of cases \[p.adj = p.value ⋅ N\]
It reduces False Positives and increases False Negatives
Sometimes we get nothing significant
How does FDR work
FDR sorts the p-values and multiplies each by an increasing value \[p.adj = p.value \cdot\frac{i}{N}\]
If we get \(p.adj<0.05\) then the probability that it is a false positive is 5%
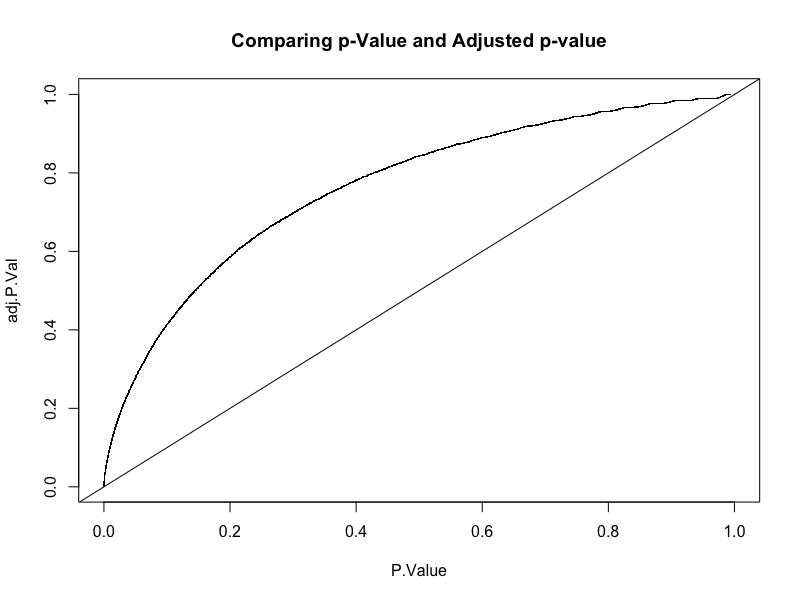
Original v/s adjusted p-value
![]()
That is how we make a Volcano plot
![]()