Class 5: Practice with sapply. The FOR loop
Computing for Molecular Biology 2
Andrés Aravena, PhD
19 March 2021
Functions: code in a box
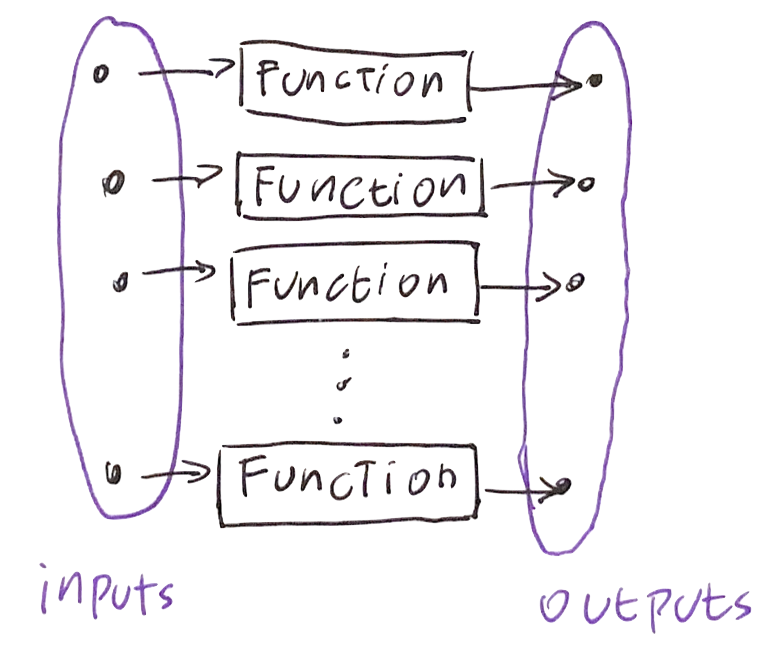
Function are like black boxes
To use a function we give the input and we receive the output

Functions are contracts between the person who uses and the person who writes the function
Appply the function to many things
The command
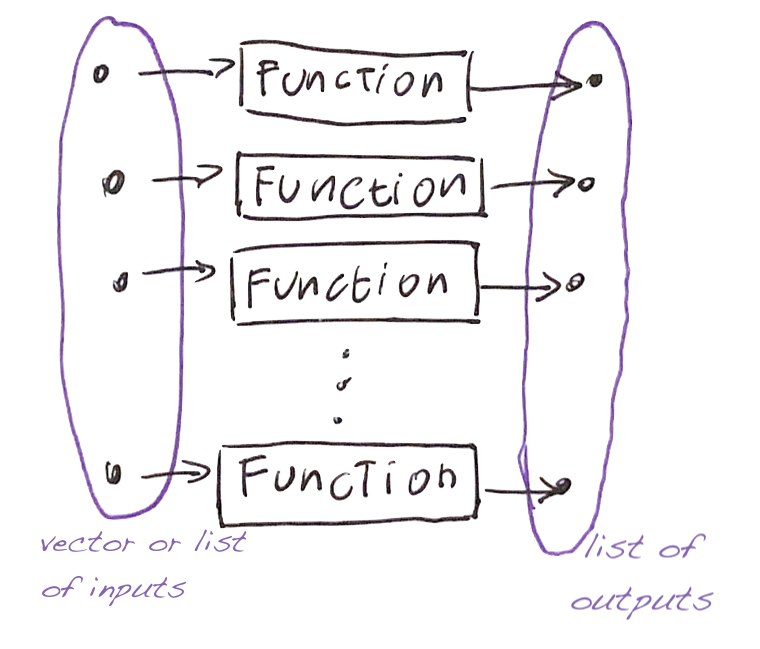
lapply(v, fun)- takes a vector (or list)
v, - applies the function
funto each element, - and returns a list.
Mapping a vector into another
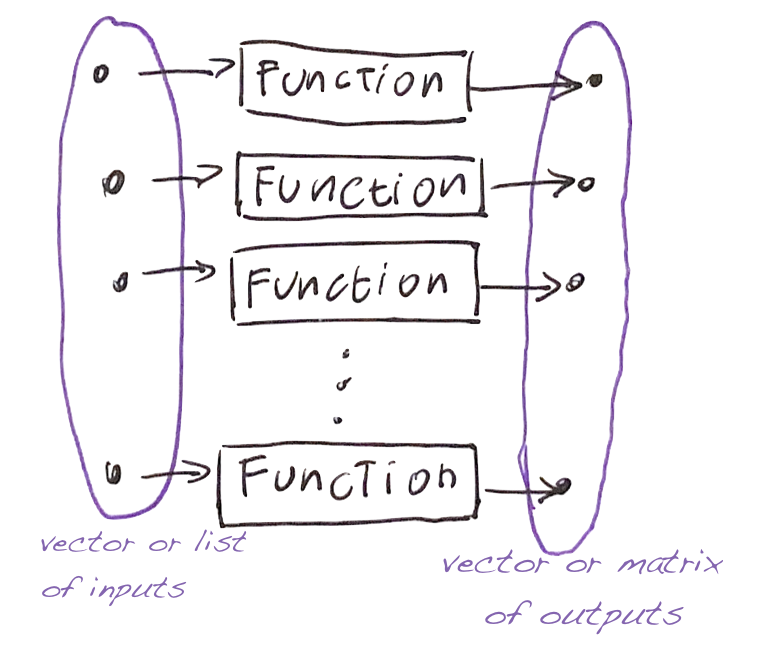
The command
sapply(v, fun)- takes a vector (or list)
v, - applies the function
funto each element, - and tries to return a vector (or a matrix).
Common case: sequence to vector
The most common case is when the vector of inputs is a numeric sequence, like
sapply(1:N, fun)There is another way

In previous version of this course we used for to repeat the same commands several times
for(index in vector) {
   commands;
}
The parts are
- an index
- a vector (or list) of values for the index
- commands that depend on the index, wraped in
{}
Third: sapply the function
GC_skew_of_genes <- sapply(genes, calculate_GC_skew)
plot(GC_skew_of_genes)