- Some organisms have been sequenced
- We can read the sequences from FASTA files
read.fastareturns a list of vectors of characters- We can create functions to do things with the sequence
- For example we do statistics of the sequence
March 11, 2020
What have we learned?
Why we do statistics on the sequence?
Statistics is a way to tell a story that makes sense of the data
In genomics, we look for biological sense
That story can be global: about the complete genome
Or can be local: about some region of the genome
We will start with global properties
GC-content
From Wikipedia, the free encyclopedia
The percentage of nitrogenous bases on a DNA molecule that are either guanine or cytosine.
- GC content is different in different organisms.
- GC content is the first tool in taxonomic classification
- I.e. You use GC content to know the organism’s name
GC-content can be measured by several means
For example, measuring the melting temperature of the DNA double helix using spectrophotometry
- The absorbance of DNA at a wavelength of 260nm increases when DNA separates into two single strands at melting temperature
Determination of GC content
If the DNA has been sequenced then the GC-content can be accurately calculated by simple arithmetic.
GC-content percentage is calculated as \[\frac{G+C}{A+T+G+C}\]
Exercise 1
Write the code for this function:
gc_content <- function(genome) {
    # count letters
    return(answer)
}
Then use it to find the GC content of E.coli
Exercise 2
Is the GC content uniform through all genome?
Do all genes have the same GC content?
What function do we need to answer this question?
What is the name, the inputs, and the output?
Exercise 2
Write the code for this function:
genes_gc_content <- function(genes) {
    # calculate GC content of each gene
    return(answer)
}
What is the data structure of answer?
Comments
- Genes from horizontal transfer usually have different GC content
- Make sure that you use the correct FASTA file
- Recommended file name extension
.fna: FASTA nucleotide. Full genome.ffn: FASTA nucleotide with features, such as genes.faa: FASTA amino-acids. Proteins or peptides
Exercise 3
Calculate the GC content for only part of the genome
Instead of all the genome, we only look through a window
The result should depend on:
- the genomic sequence
- the position of the window
- the size of the window
Write the function
The new function looks like this
window_gc_content <- function(sequence, position, size) {
    # code here
    return(answer)
}
What should be the code?
Using window_gc_content() in many places
We want to evaluate window_gc_content on different positions of the genome
positions <- seq(from=1, to=length(genome), by= window_size)
Now we apply window_gc_content to each element of positions?
for(i in 1:length(positions)) {
    gc[i] <- window_gc_content(genome, positions[i], window_size)
}
GC Skew
What is the size of \(G-C\) respect to the total \(G+C\)?
Calculate the ratio \[\frac{G-C}{G+C}\] for each gene and plot it
What do you see?
GC skew
There is a richness of G over C and T over A in the leading strand
There is a richness of C over G and A over T in the lagging strand
GC skew changes sign at the boundaries of the two replichores
This corresponds to DNA replication origin or terminus
What is the story told by GC skew?

GC skew and genome replication
GC skew changes sign at the boundaries of the two replichores
This corresponds to DNA replication origin or terminus
The replication origin is usually called ori.
We can use the Turtle to see the DNA
- For each nucleotide
- if the nucleotide is
A, turtle moves left - if the nucleotide is
T, turtle moves right - if the nucleotide is
G, turtle moves up - if the nucleotide is
C, turtle moves down
- if the nucleotide is
The Turtle walks the DNA sequence
library(TurtleGraphics)
turtle_init(mode = "clip")
turtle_hide()
for(i in 1:1000) {
    if(dna[i]=="A") {
        turtle_setangle(90)
    } else if(dna[i]=="T") {
        turtle_setangle(270)
    } else if(dna[i]=="G") {
        turtle_setangle(0)
    } else if(dna[i]=="C") {
        turtle_setangle(180)
    }
    turtle_forward(1)
}
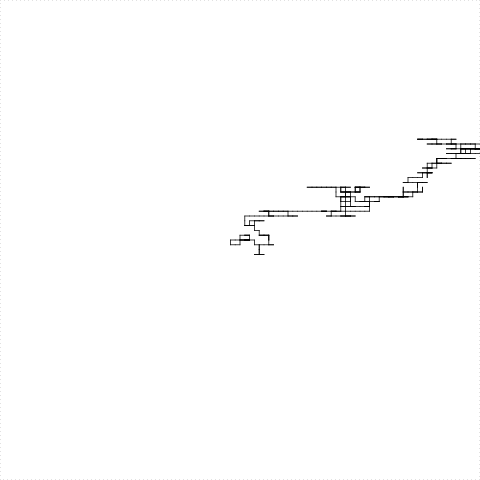
After a long time we get this

This program takes a lot of time (it is a turtle, after all)
This is the drawing of Candidatus Carsonella ruddii genome
It is the bacteria with the smallest genome
Same plot for Escherichia coli

Same plot for Schizosaccaromyces Pombe

Scientific questions about DNA-walk
- Why do we got this shape?
- What is the shape for other organisms?
- Do you think this shape is random?
- Do you think there is some logic? some structure?
- What are the minimum and maximum of each axis?
How can you answer these questions?
Technical questions
- How can you answer the previous questions?
- How can we make these drawings faster?
- How can we extract meaningful biological information from these drawings?
Comparative Genometrics
If you want to learn more about the science, read:
Roten C-AH, Gamba P, Barblan J-L, Karamata D. Comparative Genometrics (CG): a database dedicated to biometric comparisons of whole genomes. Nucleic Acids Research. 2002;30(1):142-144