Class 12: Assign Taxonomy without Aligning
Bioinformatics
Andrés Aravena
25 December 2020
Context: Metagenomics
Let’s say you get a complex sample:
- Environmental studies
- Human microbiota
- Archeology
You extract total DNA, you sequence all.
You got millions of reads
What is on these reads?
Problem: Identification
Now you ask:
- What are the organisms on this sample?
- How many of them?
- What can they do?
First idea: BLAST
We can use BLAST or other alignment tool to search our reads into a database of known organisms
If the organism is known, and has been sequenced, we can identify it
but…
Most of the reads do not align to any reference genome
(most of Prokaryotes have not been isolated)
Nucleotide composition
Some properties of DNA composition tend to be conserved through evolution
For example, two phylogenetically close species usually have similar GC content
Generalizing the idea
We can consider the relative abundance of
- dimers
- trimers
- tetramers
- pentamers
- oligomers of size \(k\)
An oligomer of size \(k\) is called 𝒌-mer
Frequency of \(k\)-mers
Given a sequence \(s\) of length \(L\), we can count all subwords of size \(k\) (\(s\) can be a genome, or a DNA fragment)
For each \(k\)-mer \(w\) we calculate its absolute frequency \(F_{(k)}(w; s)\) as the number of times that \(w\) appears in \(s\)
In other word we count the number of values \(j\) such that \((s_j, \ldots, s_{j+k-1})=w\)
Relative 𝑘-mer frequency
It is exactly as you imagine
\[f_{(k)}(w; s)=\frac{F_{(k)}(w; s)}{\sum_{v} F_{(k)}(v; s)}\]
(here \(v\) goes through all 𝑘-mers)
𝑘-mers overlap each other
First we have \((s_1, \ldots, s_{k})\)
Then we have \((s_2, \ldots, s_{k+1})\)
Then we have \((s_3, \ldots, s_{k+2})\)
And so on
How many different 𝑘-mers?
There are 4 possibilities for each letter
There are \(4^k\) different \(k\)-mers
but…
When we sequence DNA, we get one strand, randomly
If we see ATG, we also see CAT
The result should not change if we use either strand
How many different 𝑘-mers?
Each 𝑘-mer is paired with another 𝑘-mer, so only the first half counts
There are \(4^{k/2}\) distinct values
More precisely, when \(k\) is even, some 𝑘-mers do not have pair.
For example AATT is paired with itself
So the number of \(k\)-mers is
- \(4^{k/2} + 4\) when \(k\) is even
- \(4^{k/2}\) when \(k\) is odd
Example when 𝑘=1
For example, for \(k=1\) we have four 1-mers: \(A, C, G, T\)
But \(A\) pairs with \(T\), and \(C\) pairs with \(G\),
so there are only two values: \[f_{(1)}(“A”;s)+f_{(1)}(“T”,s)\text{ and }f_{(1)}(“G”;s)+f_{(1)}(“C”,s)\]
Not all values are independent
Since the sum of all frequencies is 1, the last value is determined by the rest \[f_{(1)}(“A”;s)+f_{(1)}(“T”,s)+f_{(1)}(“G”;s)+f_{(1)}(“C”,s)=1\]
So we have only one independent value: \[f_{(1)}(“G”;s)+f_{(1)}(“C”,s)\]
That is the GC content
The question
Given a read \(r\) we want to identify its origin in a set \(\{T_j\}\) of taxas (species, genus, etc.)
We want to compare the probabilities \(ℙ(T_i\vert r)\) for each taxa, and assign \(r\) to the taxa with highest probability
Calculating probabilities is hard without good tools
Instead we calculate a Score for the taxa, given the read \[\text{Score}(T_i; r)\]
Naïve Bayes Classifier
Taxonomic classification is done in two parts
First we train, by counting 𝑘-mers in known genomes
- We have to remember the taxonomy (species, genus, etc.) of each organism, and the count of 𝑘-mers
Second, we apply the classifier to a new sequence
In summary
When we train, we get \(f_{(k)}(w; T_i)\) for each 𝑘-mer \(w\) in taxa \(T_i\)
Then the score for \(T_i\) given the read \(r\) is \[
\text{Score}(T_i; r)=\sum_i \log f_{(k)}(r_i\ldots r_{j+k-1}; T_i)
\]
which can also be written as \[
\text{Score}(T_i; r)=\sum_{w\in r} F_{(k)}(w; T_i)\log f_{(k)}(w; T_i)
\]
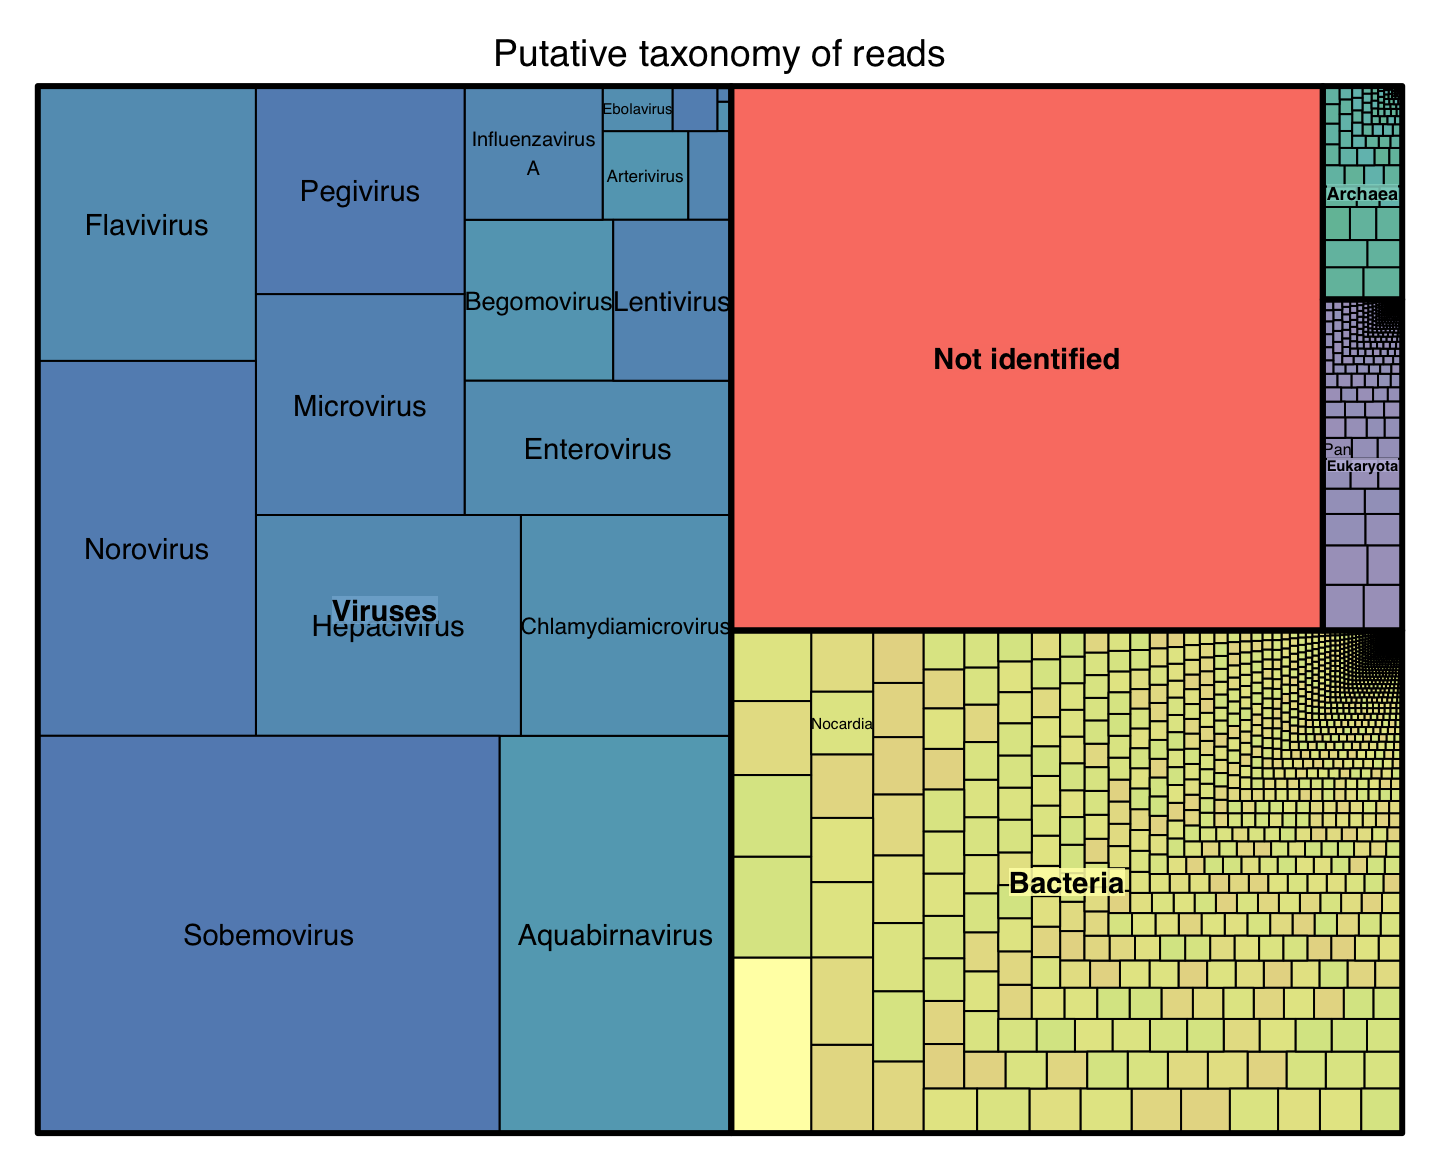
Results with real data
![]()
Collaboration with Stockholm University
Each taxa is characterized by the vector of 𝑘-mer frequencies
and nothing else
(in this model)
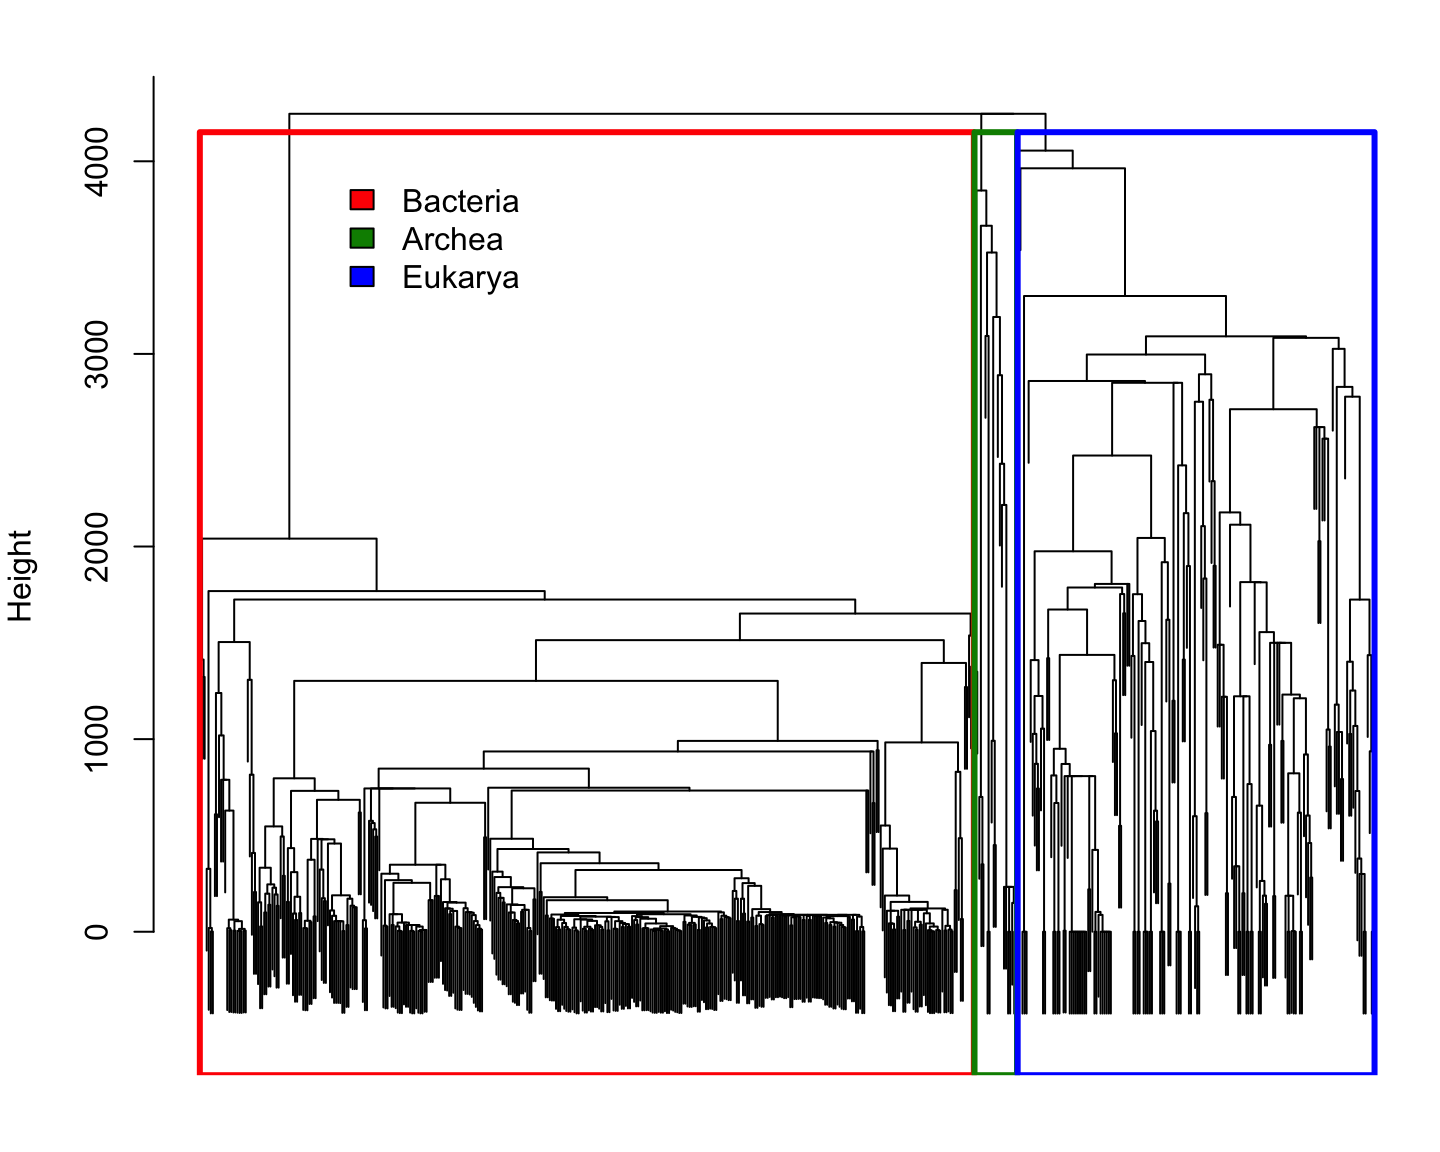
Hypothesis to Test
We built a platform that allow us to test these hypothesis:
Reference Phylogenetic distance
![]()
For this analysis we need to know how long ago two species diverged
We used the values published in TimeTree.org: 2274 Studies, 50K Species
Hedges et al, Mol. Biol. and Evol. (2015)
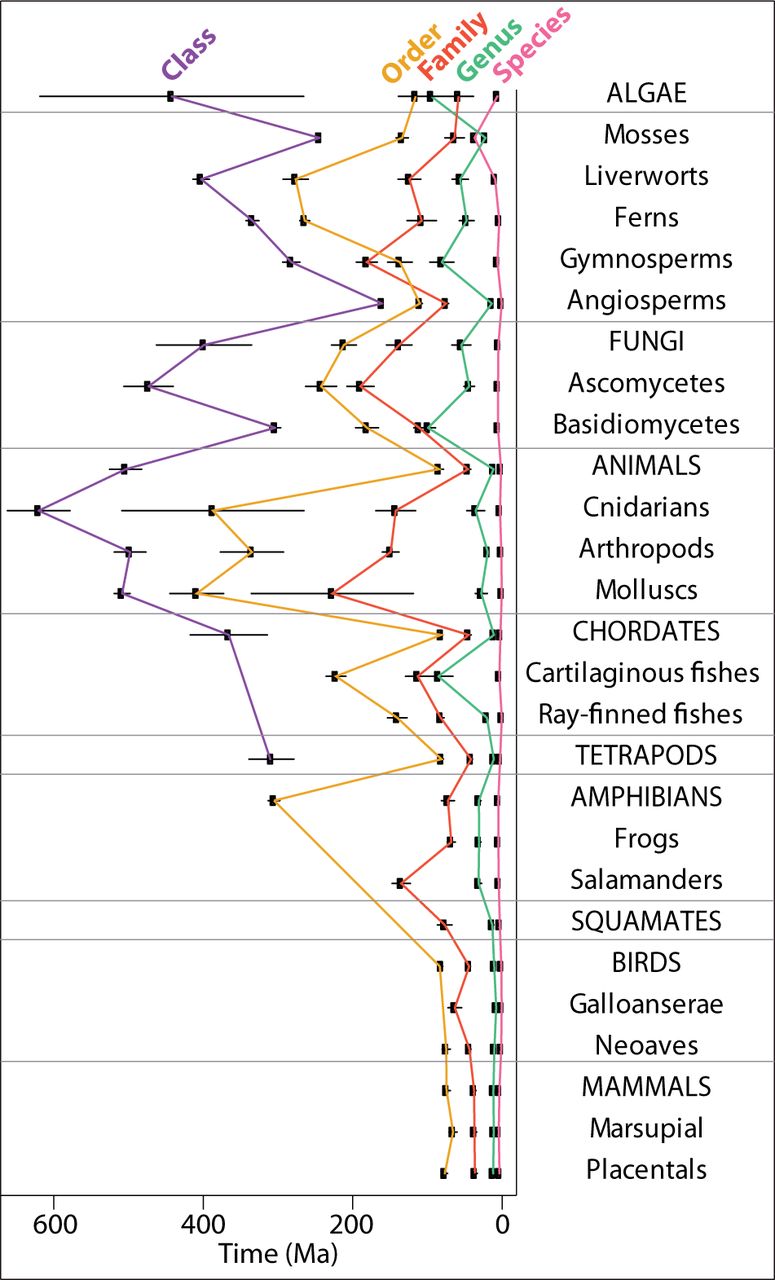
Taxonomy or Phylogeny?
![]()
For this analysis we need to know how long ago two species diverged
Linnaean taxonomic ranks have some temporal inconsistencies
Hedges et al, Mol. Biol. and Evol. (2015)
Reference Phylogenetic distance
We used the values published in TimeTree.org
- Hedges, S. Blair, Joel Dudley, and Sudhir Kumar. “TimeTree: A Public Knowledge-Base of Divergence Times among Organisms.” Bioinformatics 22, no. 23 (2006): 2971–72. doi:10.1093/bioinformatics/btl505.
- Hedges, S. Blair, Julie Marin, Michael Suleski, Madeline Paymer, and Sudhir Kumar. “Tree of Life Reveals Clock-like Speciation and Diversification.” Molecular Biology and Evolution 32, no. 4 (2015): 835–45. doi:10.1093/molbev/msv037.
- 2274 Studies, 50K Species
There is an recent update
![]()
Kumar, Sudhir, et al. “TimeTree: a resource for timelines, timetrees, and divergence times.” Molecular Biology and Evolution 34.7 (2017): 1812-1819.
- 3163 Studies, 97K Species
Provides an estimation of divergence time
The current presentation uses 2015 data
There are only 570 species in both TimeTree and RefSeq
Enough to make 163K comparisons
Phylogenetic distance for Reference species
![]()
Phylogenetic distance for Reference species
![]()
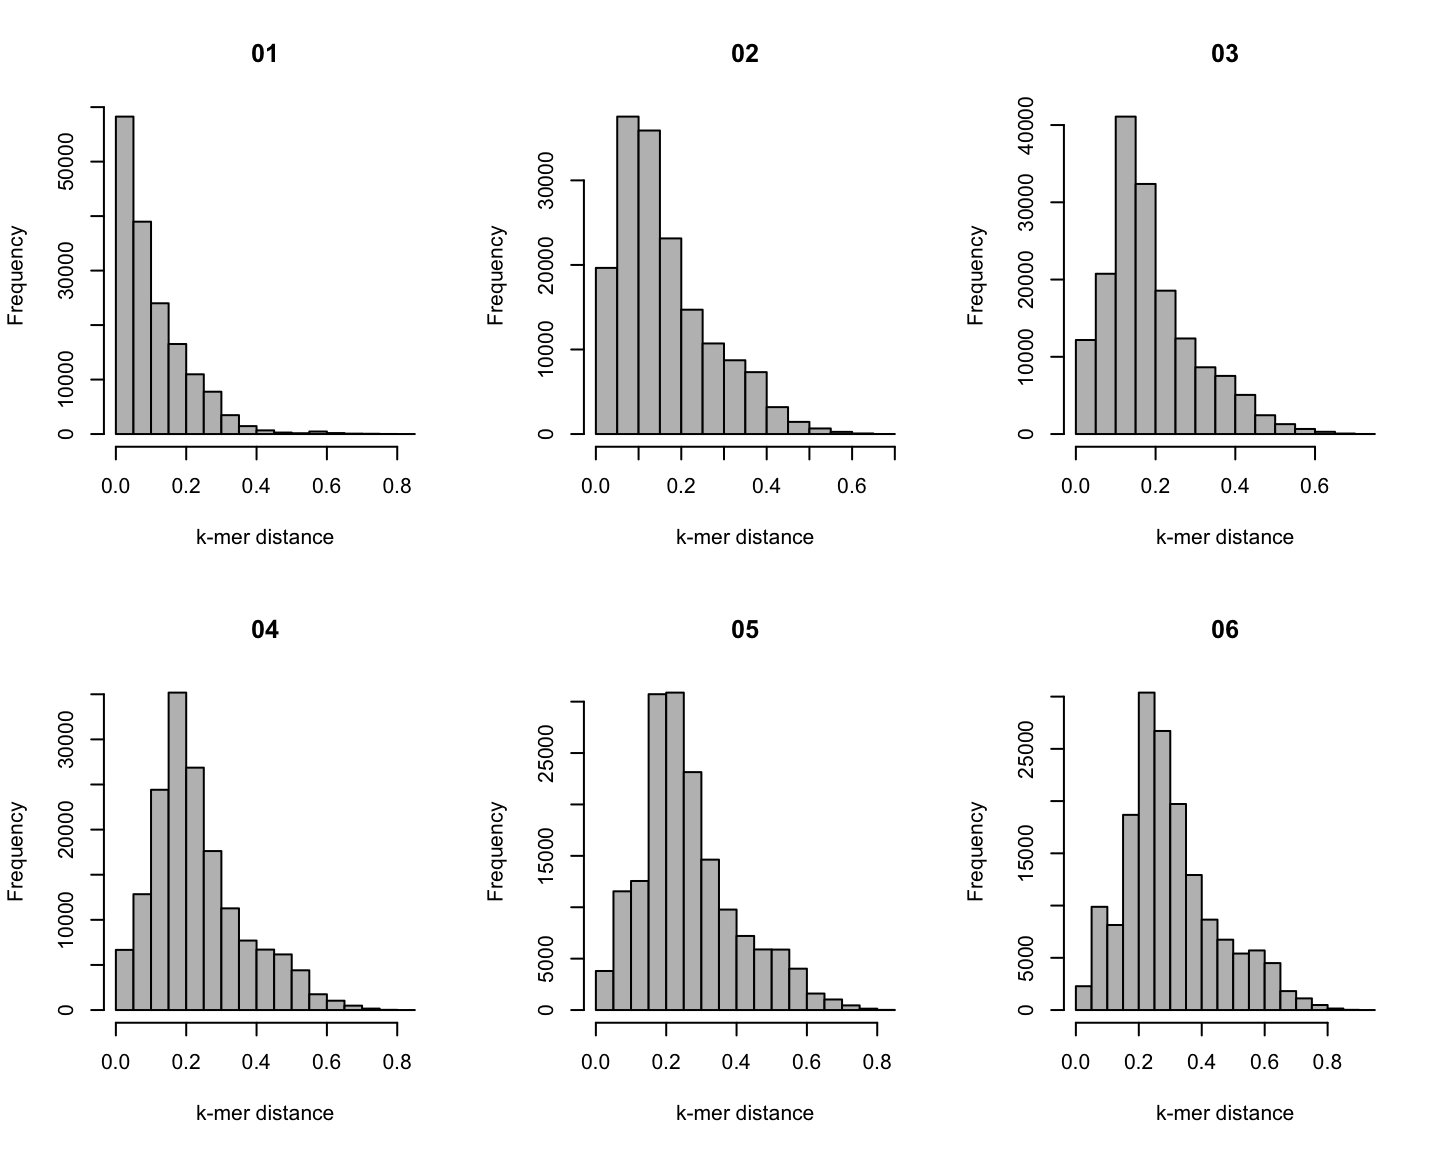
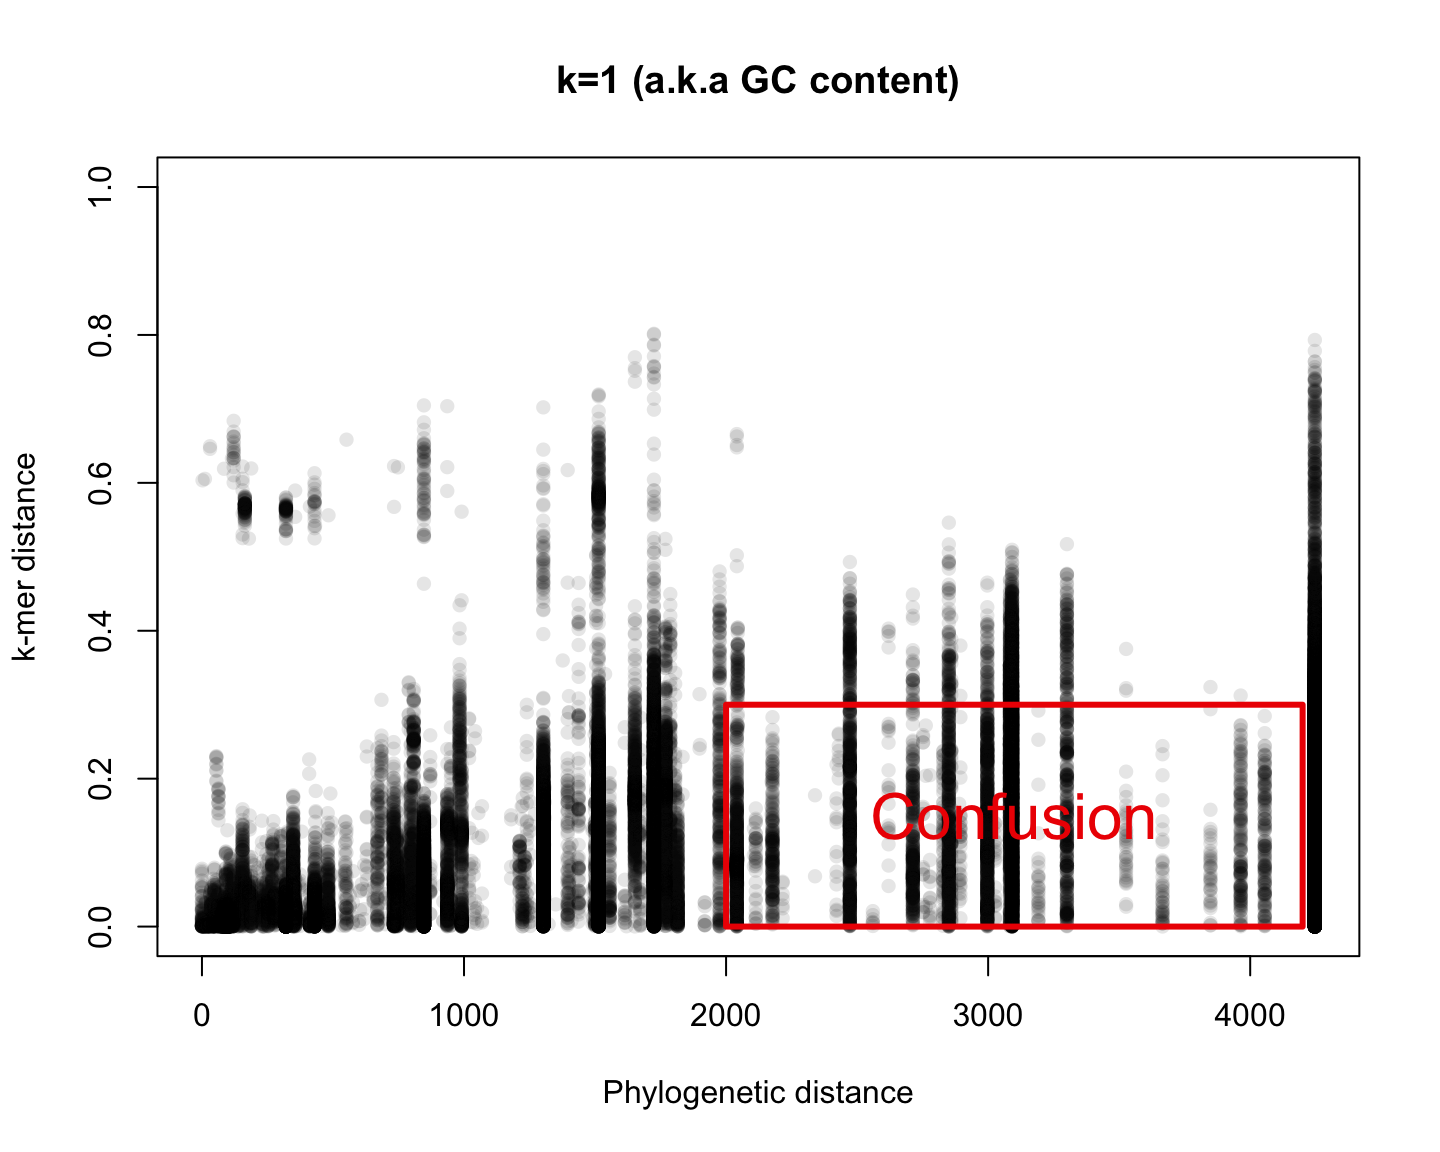
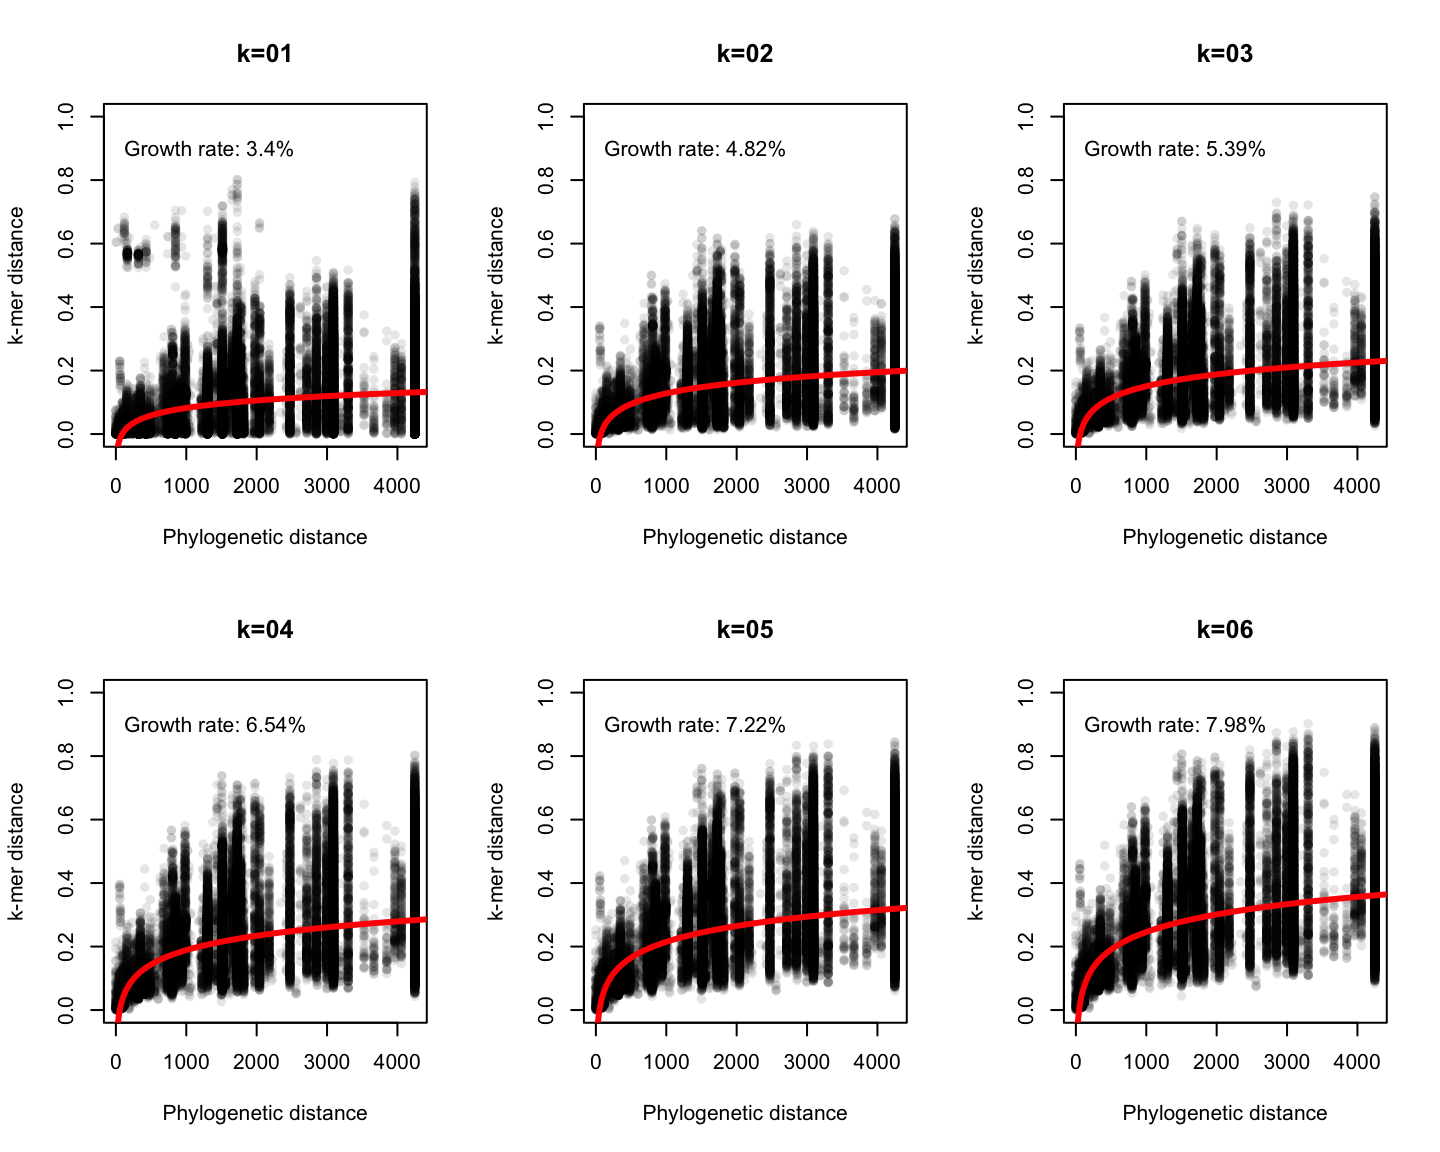
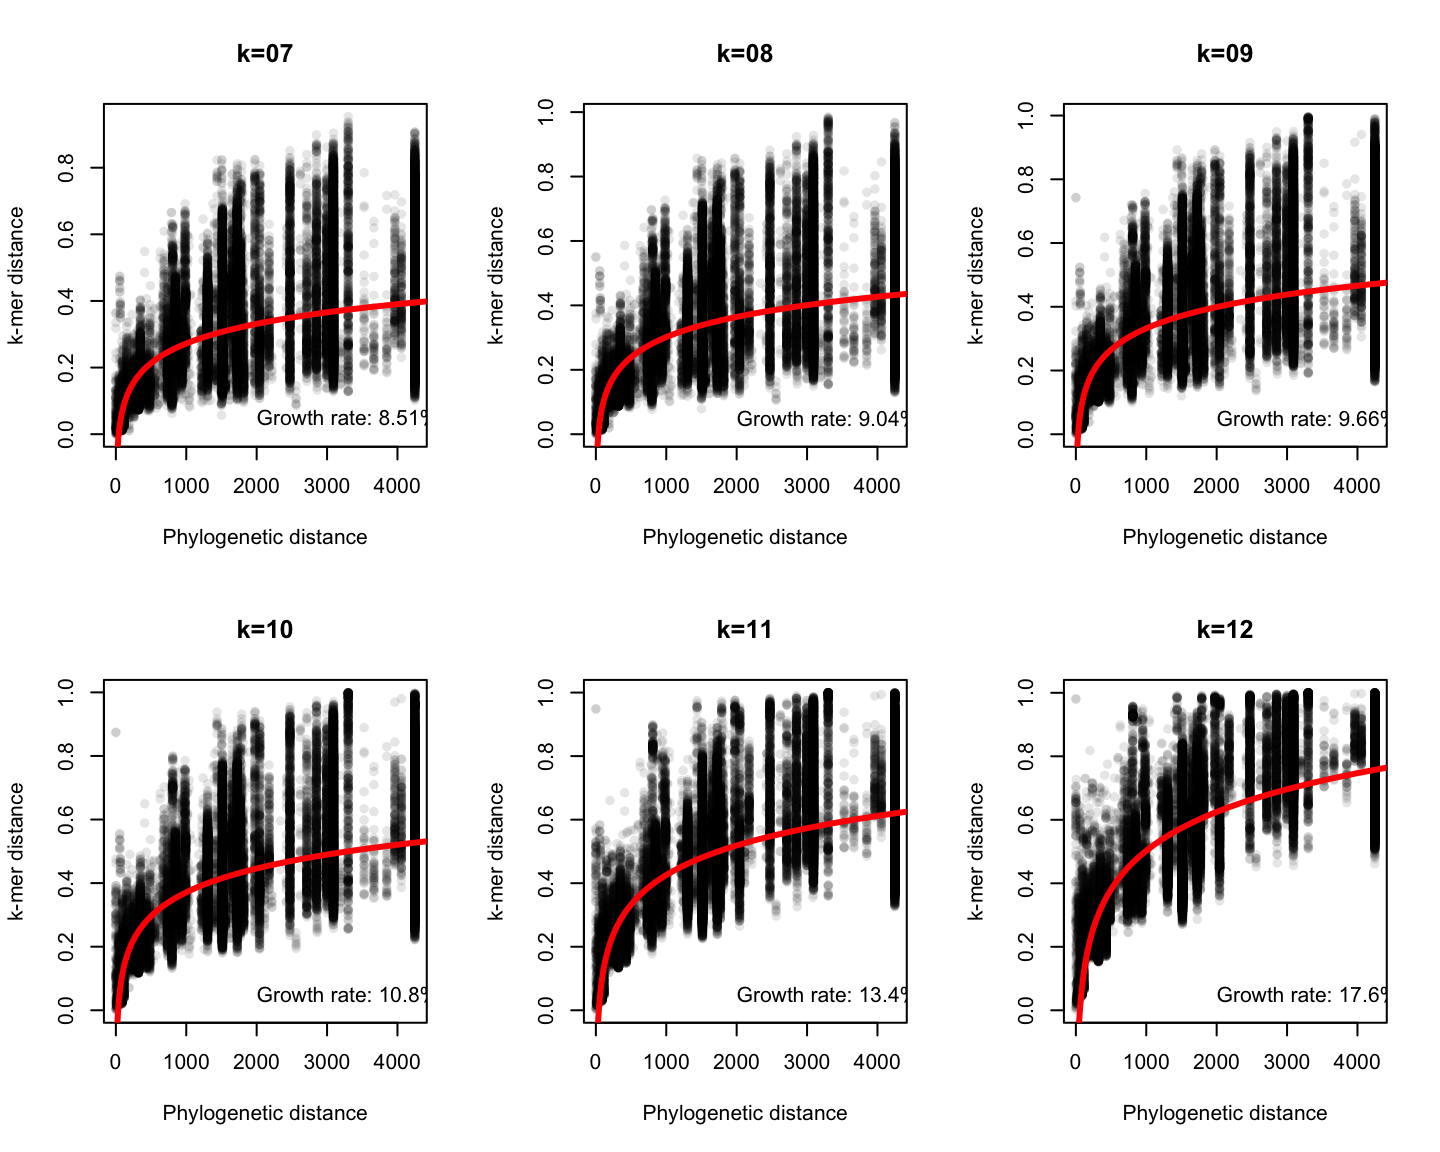
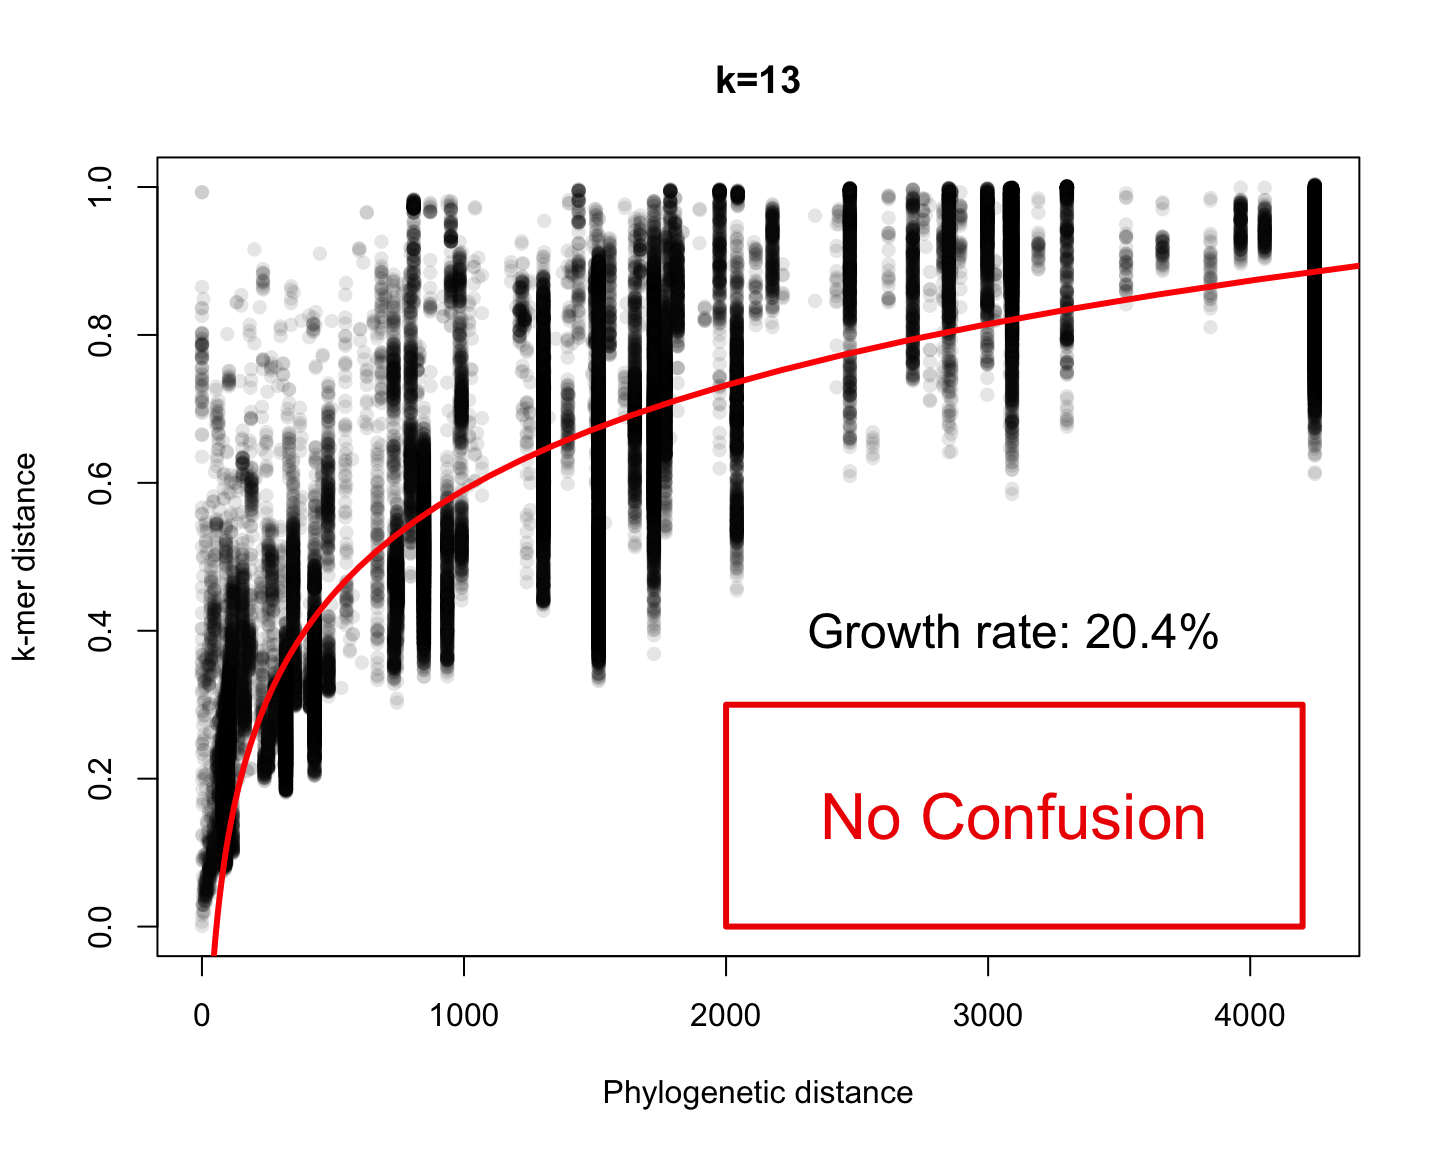
Comparing species using \(k\)-mer
Every species is represented by the frequency of each \(k\)-mer
(i.e. empirical probability distributions)
We can compare two probability distributions using the Total Variation distance: \[\mathrm{dist_{TV}}(p, q)= \frac{1}{2}\sum_i\vert p_i-q_i\vert\]
Since all probability distributions follow \(\sum_i\vert p_i\vert=1\), it is easy to see that this measure makes sense
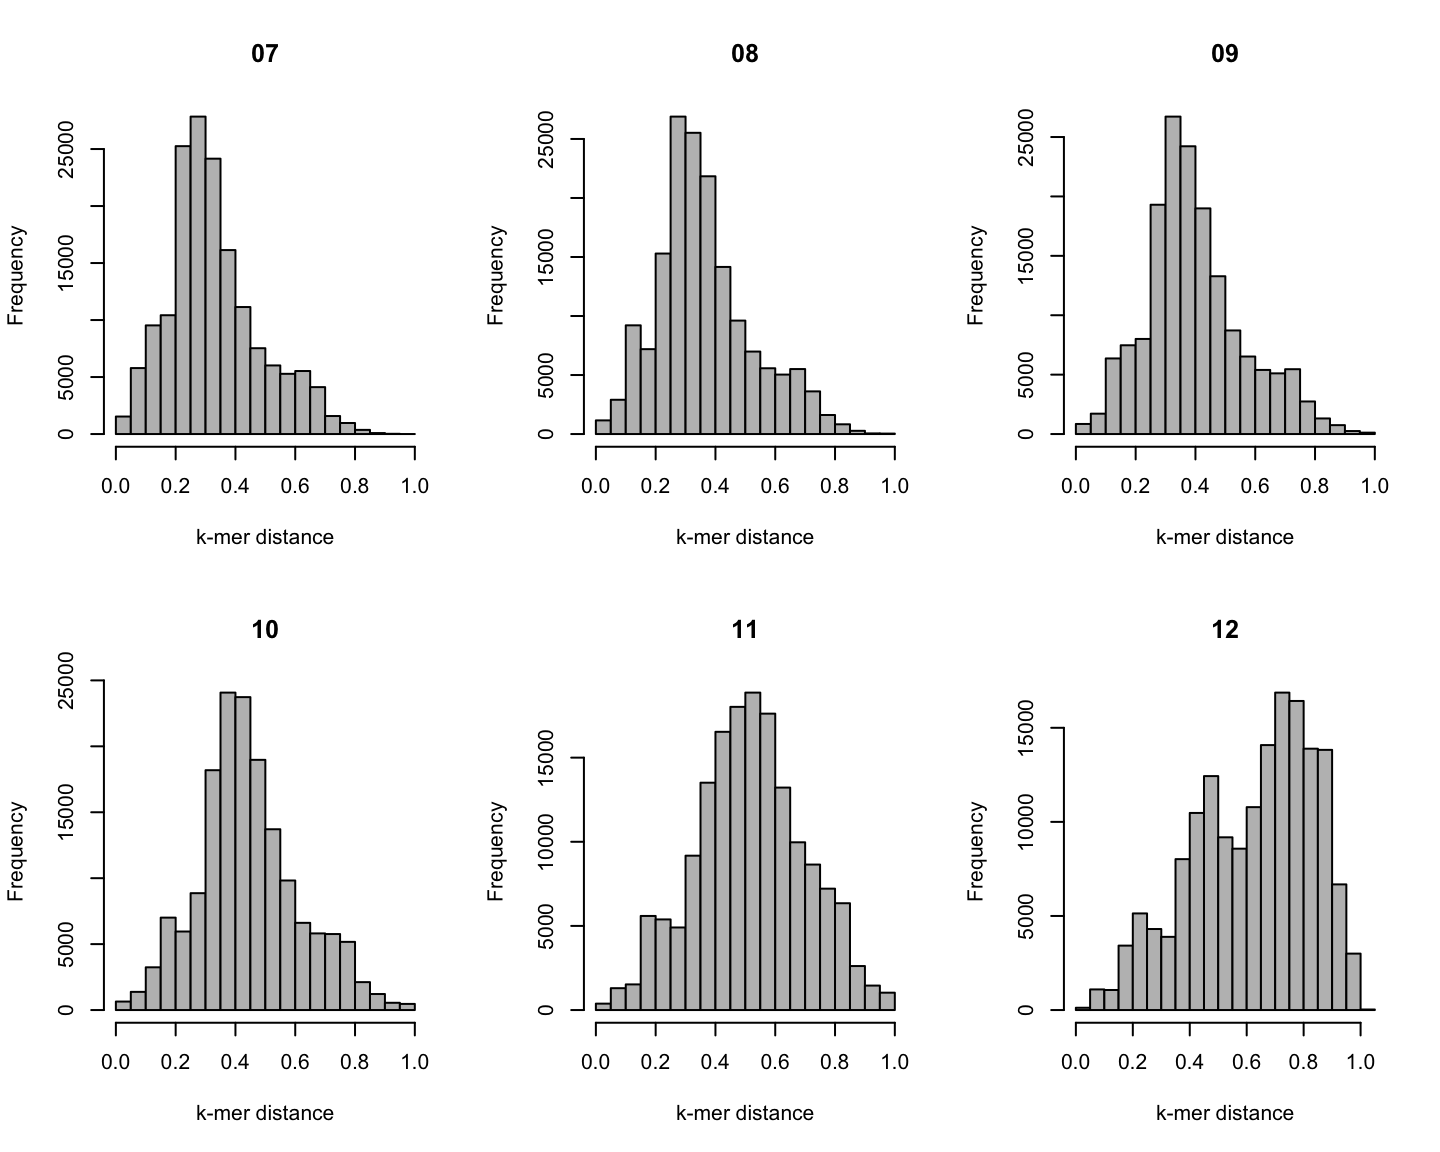
Distribution of \(k\)-mer distances
![]()
Distribution of \(k\)-mer distances
![]()
Phylogenetic v/s k-mer distance
![]()
Phylogenetic v/s k-mer distance
![]()
Phylogenetic v/s k-mer distance
![]()
Phylogenetic v/s k-mer distance
![]()