December 20, 2019
Bioidentification of metagenomic samples
another case for alignment free methods
Context: Metagenomics
Let’s say you get a complex sample:
- Environmental studies
- Human microbiota
- Archeology
You extract total DNA, you sequence all.
You got millions of reads
What is on these reads?
Problem: Identification
Now you ask:
- What are the organisms on this sample?
- How many of them?
- What can they do?
Most of the reads do not align to any reference genome
(most of Prokaryotes have not been isolated)
Two approaches to identify a read
- similarity based: i.e. alignment
- highly specific
- low sensitivity
- composition based: \(k\)-mer frequency
- low specificity
- high sensitivity
Identification without alignment
Given a DNA read \(r\) we want to find which species \(S\) is the most probable origin of the read
We want to find an \(S\) that maximizes \(\Pr(\text{species is }S\vert \text{we saw }r)\)
Thus, the question is how to evaluate this probability. Some approaches:
- Naïve Bayes Classification (Rosen 2008)
- RaiPhy (Nalbantoglu 2011)
Nucleotide composition
Some properties of DNA composition tend to be conserved through evolution
For example, two phylogenetically close species usually have similar GC content
Generalizing the idea, we can consider the relative abundance of
- di-nucleotides
- tri-nucleotides
- and longer oligomers of size \(k\)
An oligomer of size \(k\) is called \(k\)-mer
\(k\)-mers
Given a sequence \(s\) of length \(L\), we characterize it by a vector counting all subwords of size \(k\)
Given a DNA “word” \(w\in {\cal A}^k\) of length \(k\), we define
- Absolute frequency \(n_{(k)}(w;s)=\sum_j[s_j\ldots s_{j+k-1}=w]\)
- Relative frequency \(f_{(k)}(w;s)=n_{(k)}(w;s)/\sum_{v\in\cal A} n_{(k)}(v;s)\)
Remember that \(\mathcal A = \{A,C,G,T\}\) and that \([Q]=1\) iff \(Q\) is true.
How many different k-mers?
The classification must be invariant to reverse complement
The representation should not change if we use either strand
- \(D_k=4^{k/2} + 4[k\text{ even}]\) distinct values
- \(D_k-1\) linearly independent values
- So for \(k=1\) we have only one value: GC content
Prob. of a \(k\)-mer given a specie

Hypothesis to Test
We built a platform that allow us to test these hypothesis:
Phylogenetically close species have similar distribution of \(k\)-mer frequencies
Phylogenetically distant species have very different \(k\)-mer distributions
Reference Phylogenetic distance
 For this analysis we need to know how long ago two species diverged
We used the values published in TimeTree.org: 2274 Studies, 50K Species
Taxonomy or Phylogeny?

For this analysis we need to know how long ago two species diverged
Linnaean taxonomic ranks have some temporal inconsistencies
- The class angiosperm has lower average age than the order of fungus < !– + an order of animal averages younger than genus of basidiomycete fungus ->
- Ranks for prokaryotes are all older than the corresponding ranks of eukaryotes
Reference Phylogenetic distance
We used the values published in TimeTree.org
- Hedges, S. Blair, Joel Dudley, and Sudhir Kumar. “TimeTree: A Public Knowledge-Base of Divergence Times among Organisms.” Bioinformatics 22, no. 23 (2006): 2971–72. doi:10.1093/bioinformatics/btl505.
- Hedges, S. Blair, Julie Marin, Michael Suleski, Madeline Paymer, and Sudhir Kumar. “Tree of Life Reveals Clock-like Speciation and Diversification.” Molecular Biology and Evolution 32, no. 4 (2015): 835–45. doi:10.1093/molbev/msv037.
- 2274 Studies, 50K Species
There is an recent update

- Kumar, Sudhir, et al. “TimeTree: a resource for timelines, timetrees, and divergence times.” Molecular Biology and Evolution 34.7 (2017): 1812-1819.
- 3163 Studies, 97K Species
Provides an estimation of divergence time ## The current presentation uses 2015 data
There are only 570 species in both TimeTree and RefSeq
Enough to make 163K comparisons
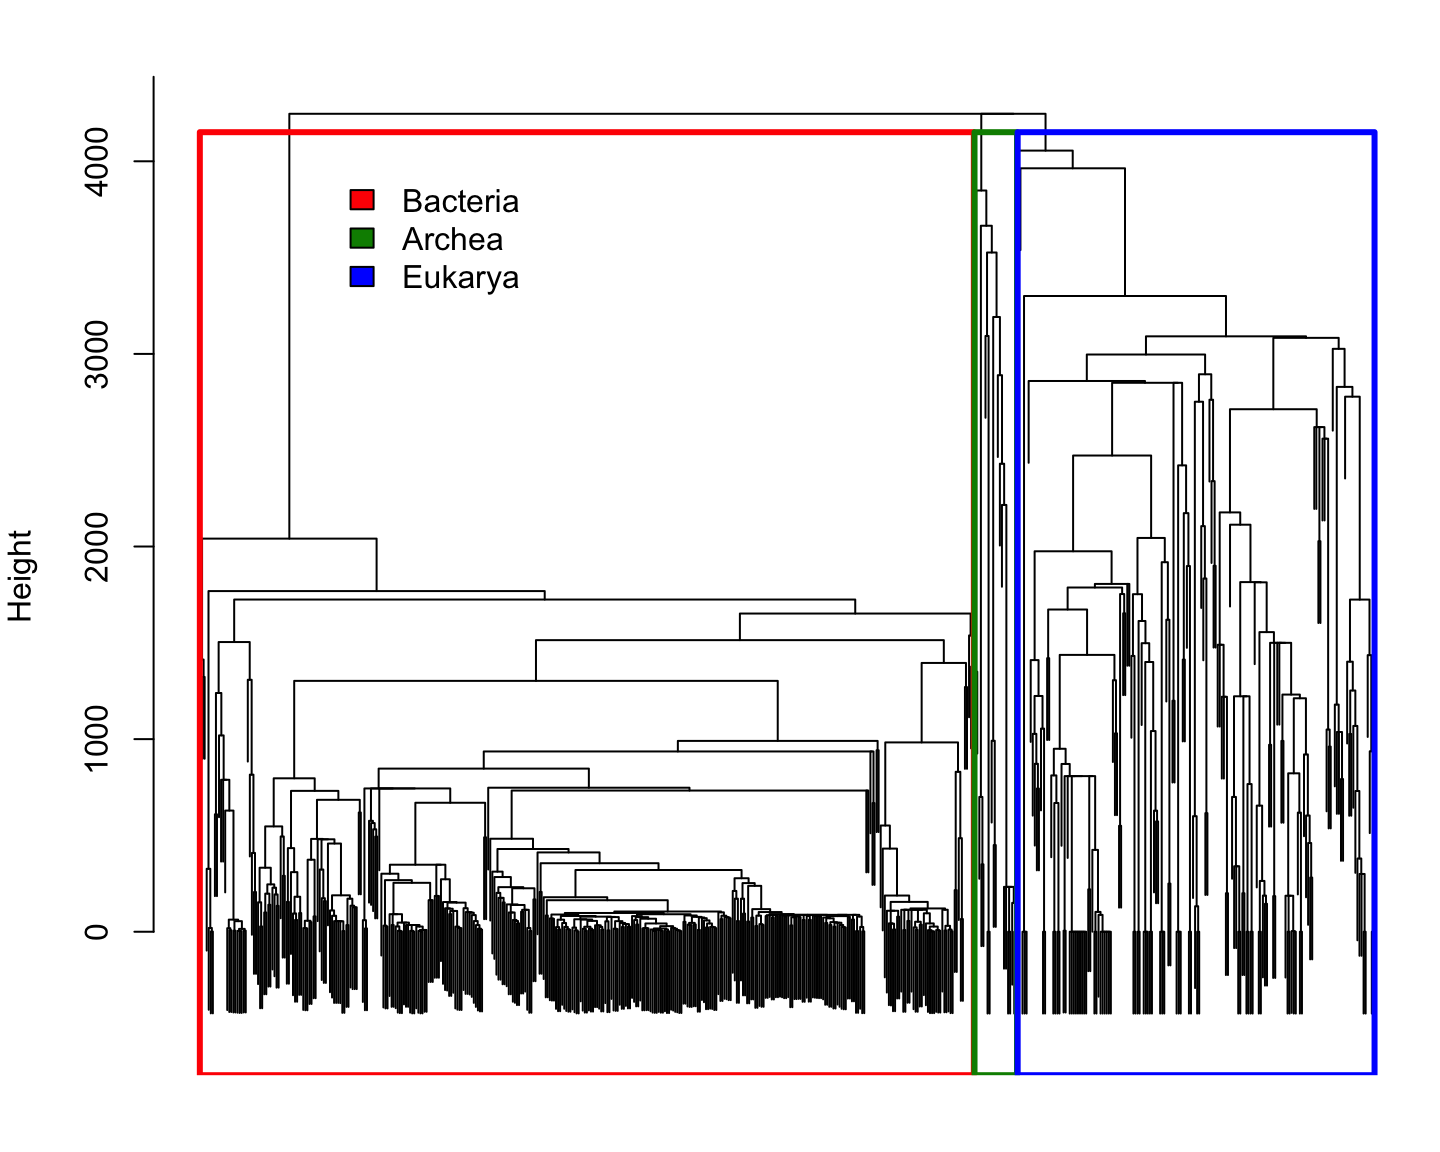
Phylogenetic distance for Reference species

Phylogenetic distance for Reference species
Comparing species using \(k\)-mer
Every species is represented by the frequency of each \(k\)-mer
(i.e. empirical probability distributions)
We can compare two probability distributions using the Total Variation distance: \[\mathrm{dist_{TV}}(p,q)=\frac{1}{2}\Vert p-q\Vert_1 = \frac{1}{2}\sum_i\vert p_i-q_i\vert\] (it happens to be half the Manhattan distance)
Since all probability distributions follow \(\sum_i\vert p_i\vert=\Vert p\Vert_1=1\), it is easy to see that the Manhattan distance is a good one.
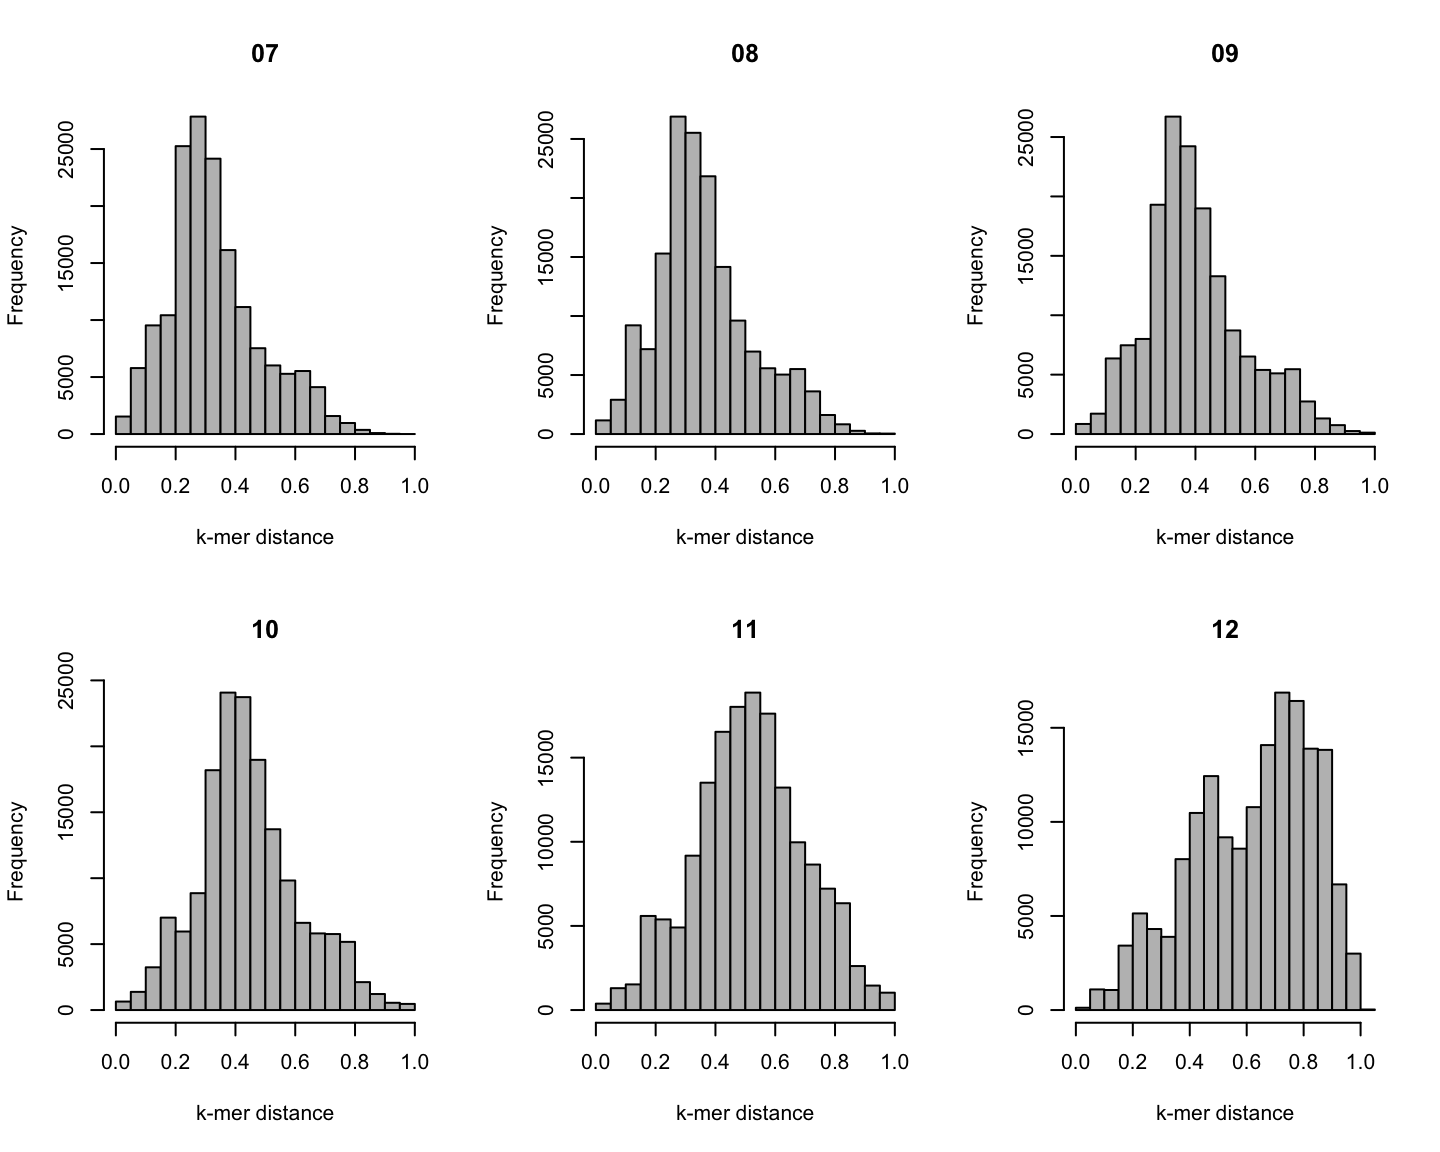
Distribution of \(k\)-mer distances
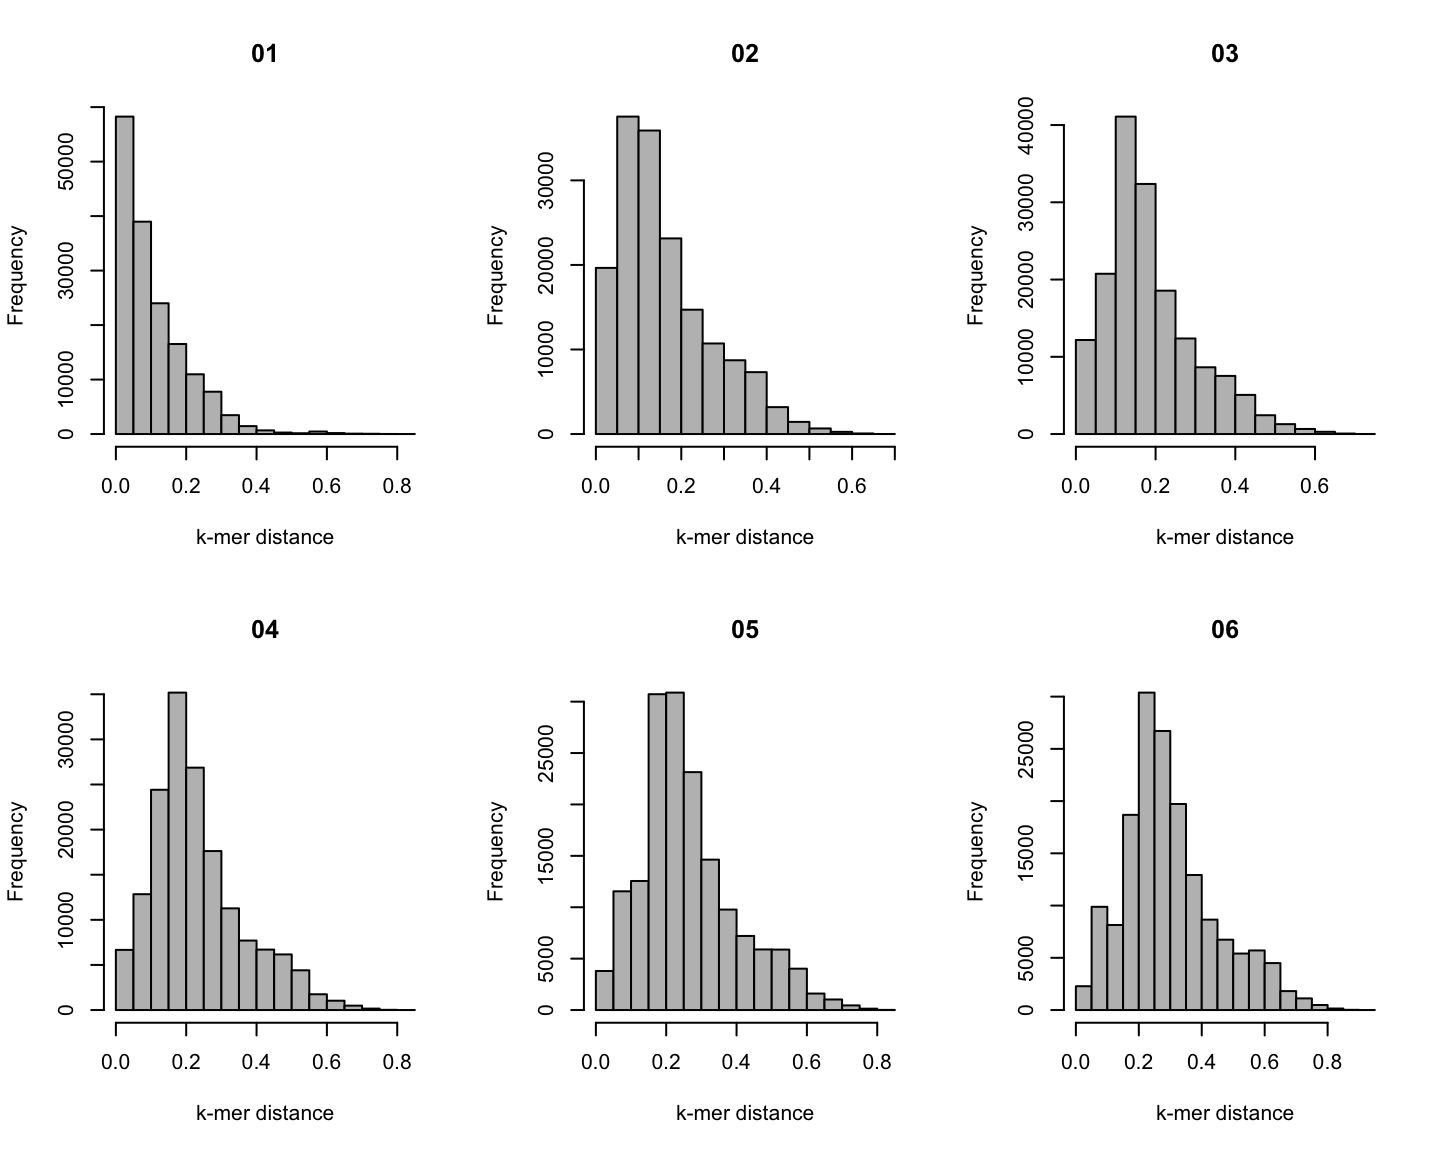
Distribution of \(k\)-mer distances
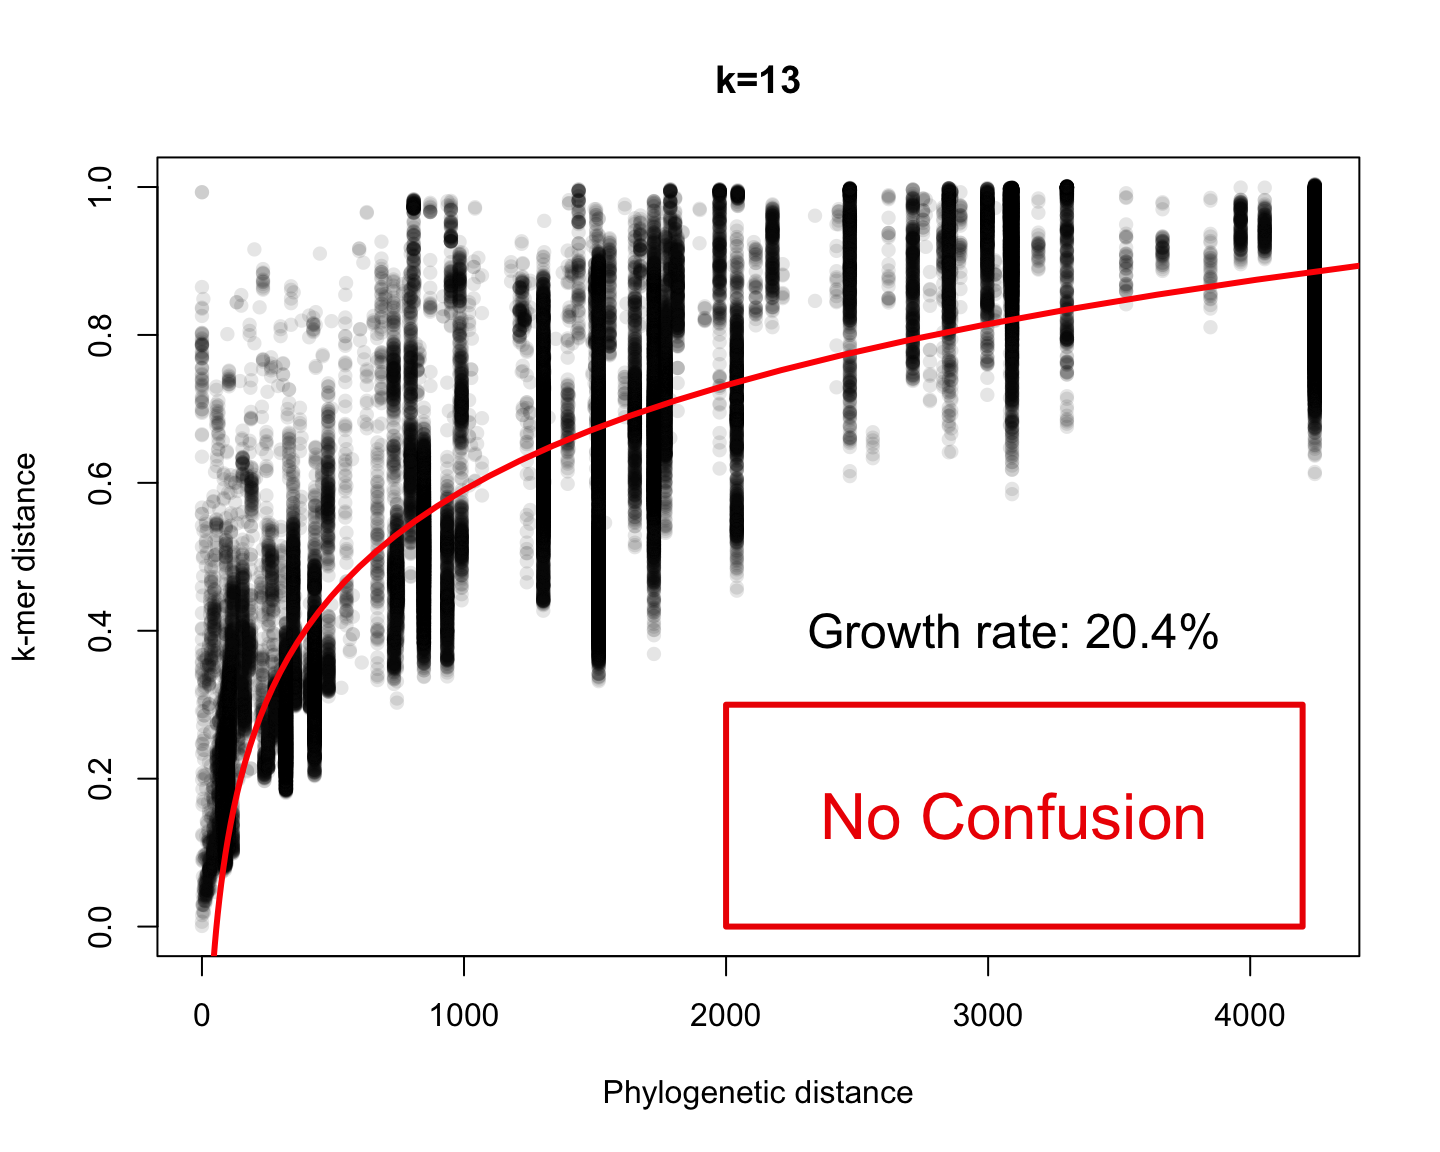
Phylogenetic v/s k-mer distance
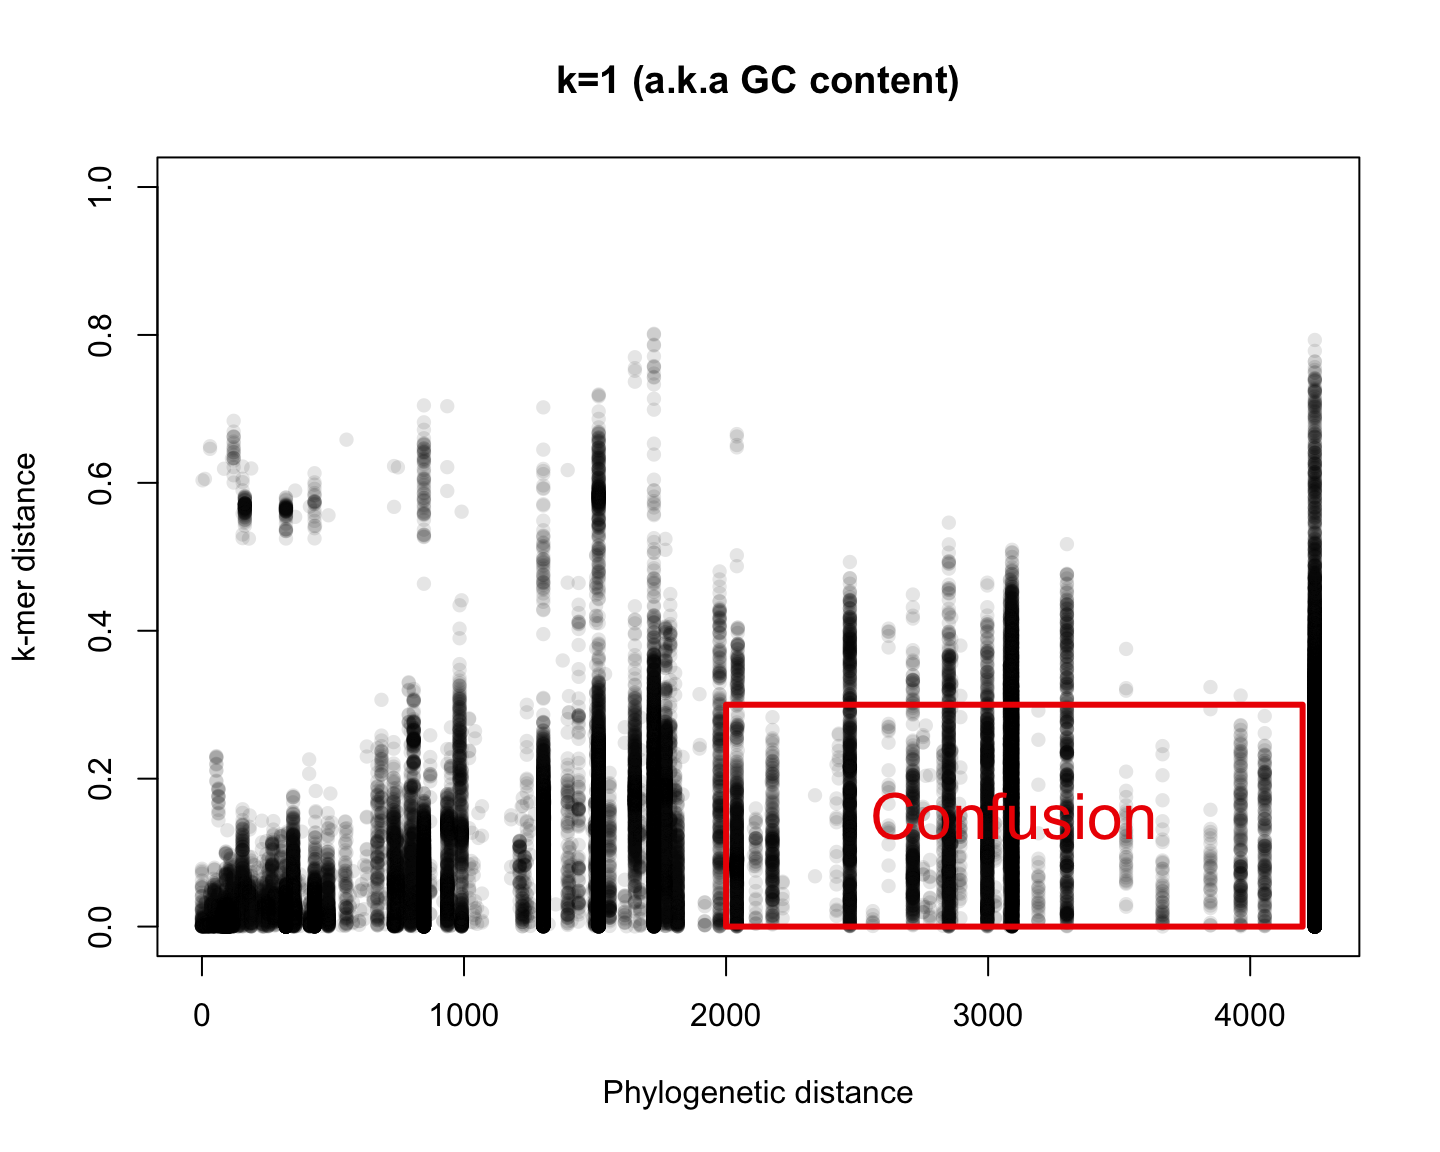
Phylogenetic v/s k-mer distance
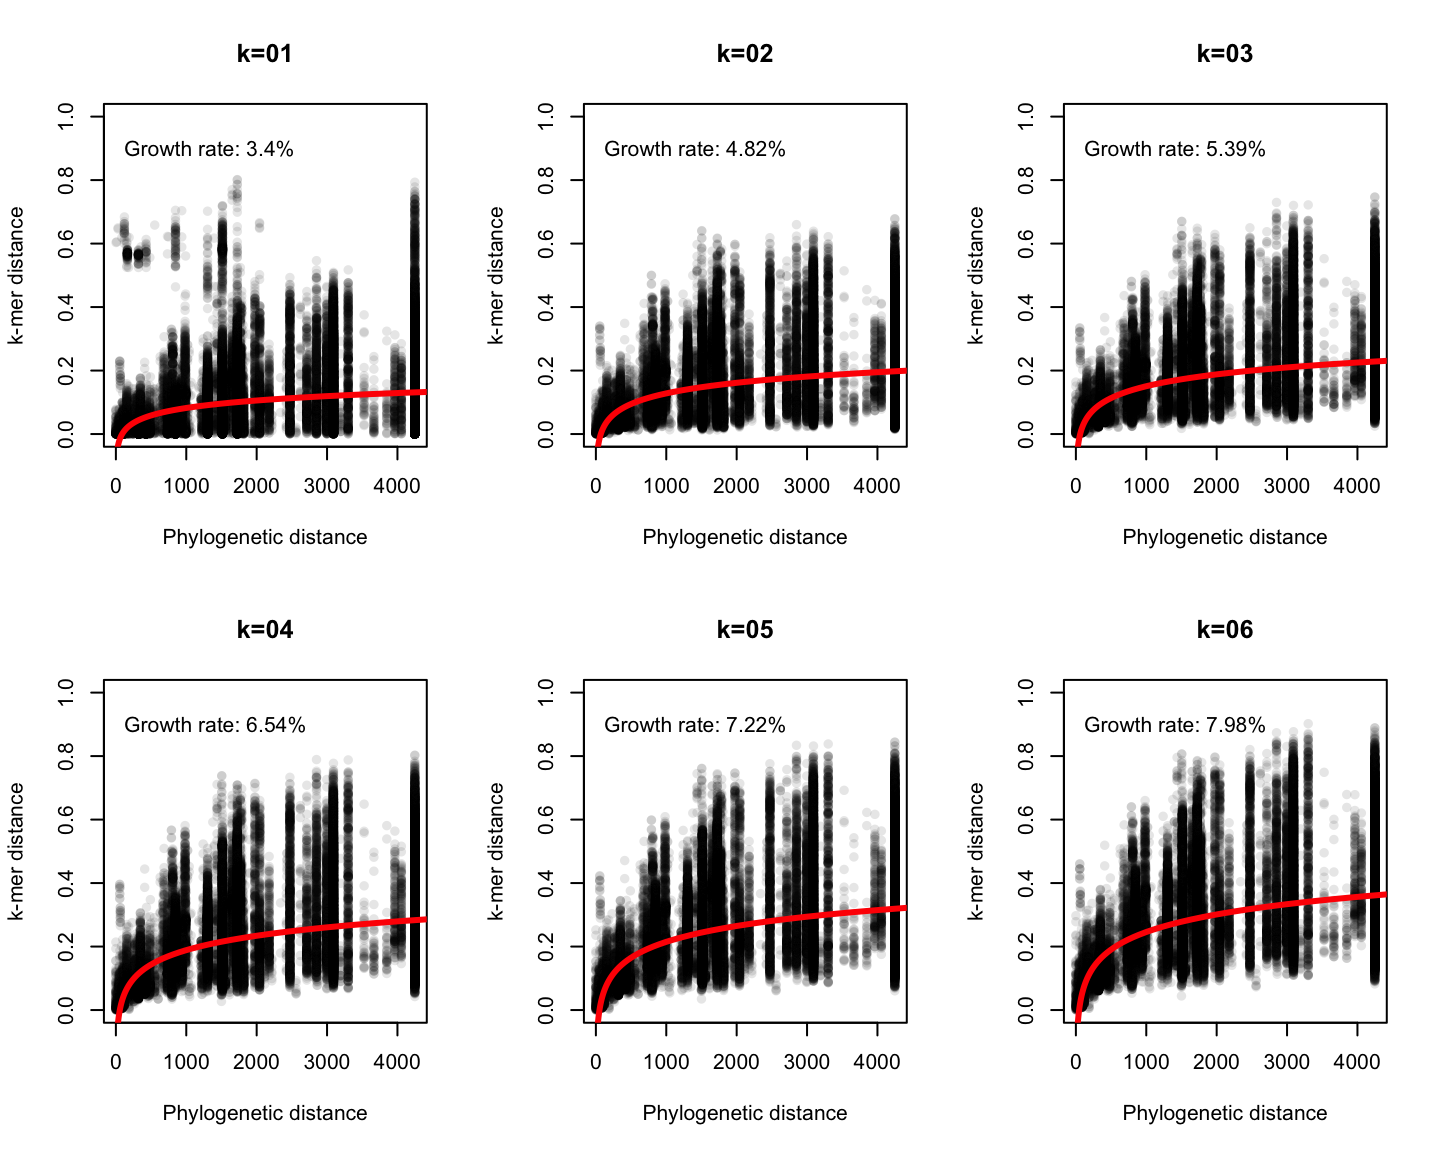
Phylogenetic v/s k-mer distance
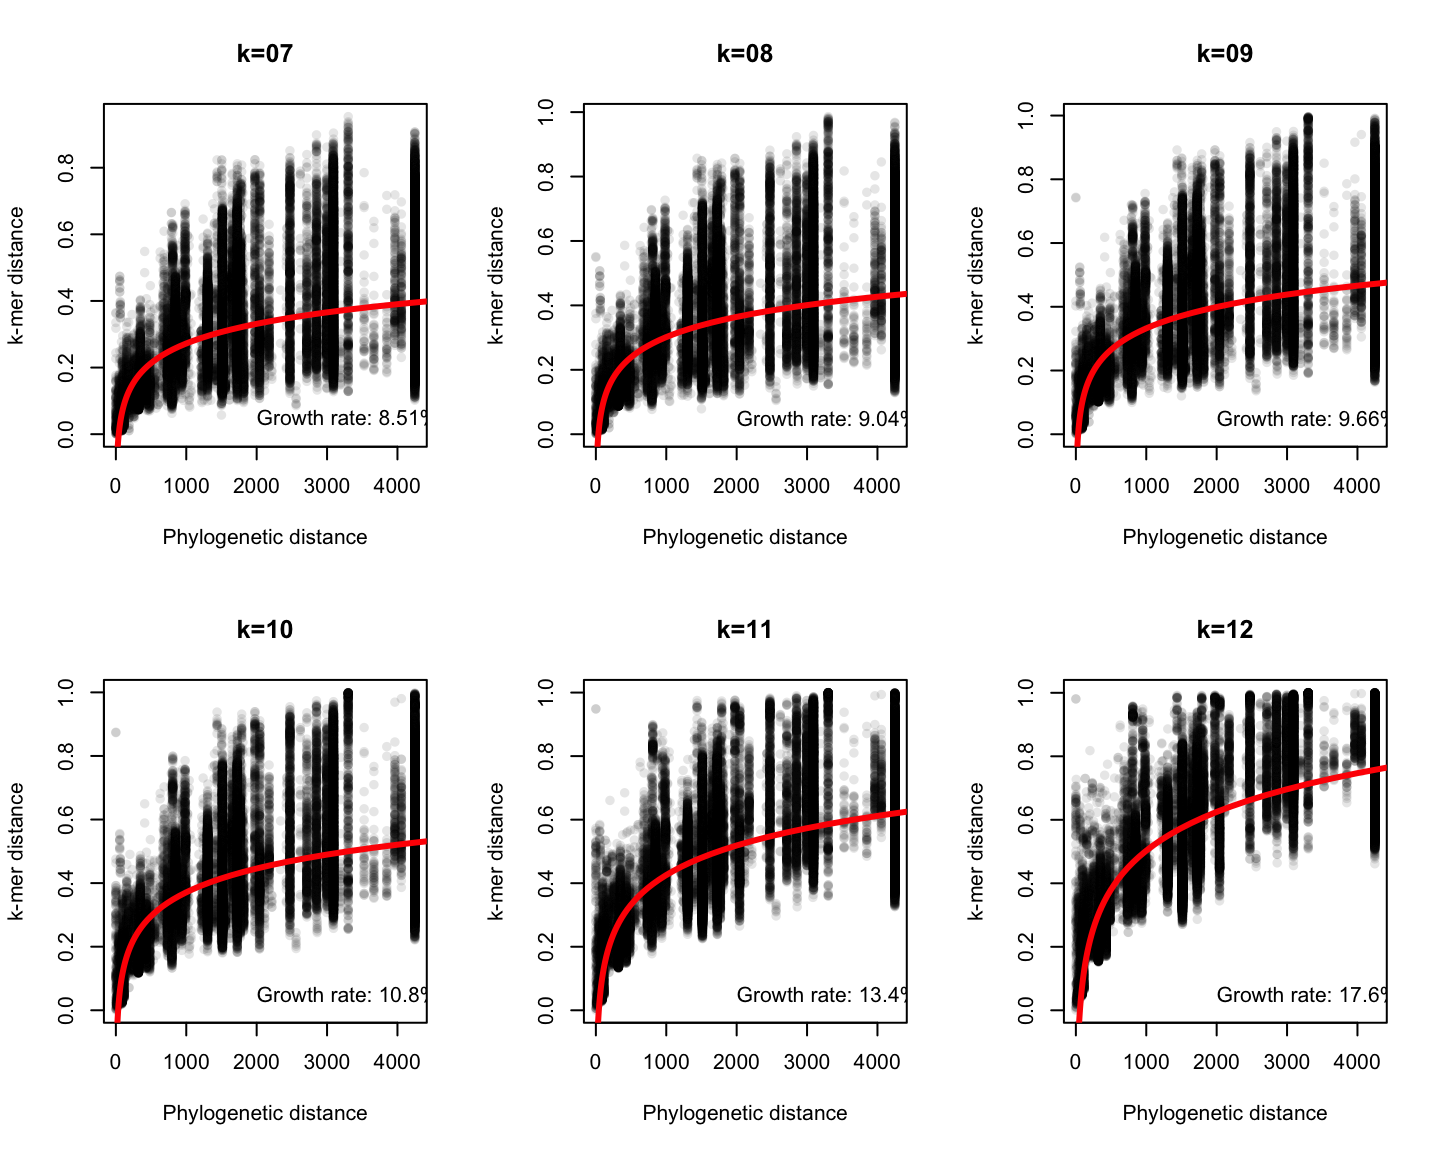
Phylogenetic v/s k-mer distance