- cumulative | ˈkyo͞omyələdiv, ˈkyo͞omyəˌlādiv |
- § (adjective) increasing in quantity, degree, or force by successive additions.
- § increasing, accumulative, growing, mounting; collective, aggregate, amassed.
- § the cumulative effect of two years of drought
- § the effects of pollution are cumulative
March 16, 2018
The dictionary says
Cumulative sum
Everyday you spend some money
Some days you receive money
How much money you have each day?
Cumulative Sum: daily balance
The income can be positive (salary) or negative (expenses)
The balance on first day is your initial money
The balance of today is the balance of yesterday plus the income of today
\[\text{balance}[today]=\text{balance}[yesterday] + \text{income}[today]\]
balance and income are vectors
Since they have different values every day, we represent the income on day i by income[i]
We also represent the balance on day i by balance[i]
The vector income has the values for all days
The element income[i] has the value for a single day
If we know income, we can calculate balance
The balance on first day is your initial money
balance[1] <- income[1]
The balance of today is the balance of yesterday plus the income of today
for(i in 2:length(income)) {
    balance[i] <- balance[i-1] + income[i]
}
Balance looks like this
The same idea applies to GC-skew
The GC skew in each window is like the income in each day
And we want to see the “balance”
cum_skew[1] <- skew[1]
for(i in 2:length(skew)) {
    cum_skew[i] <- cum_skew[i-1] + skew[i]
}
Same pattern, same solution
Let’s see it with Carsonella ruddii
Please download the FASTA of the genome of AP009180
library(seqinr)
sequences <- read.fasta("AP009180.fna")
dna <- sequences[[1]]
This bacteria has a very small genome, near 150 Kbp
So it is easy to use in classes
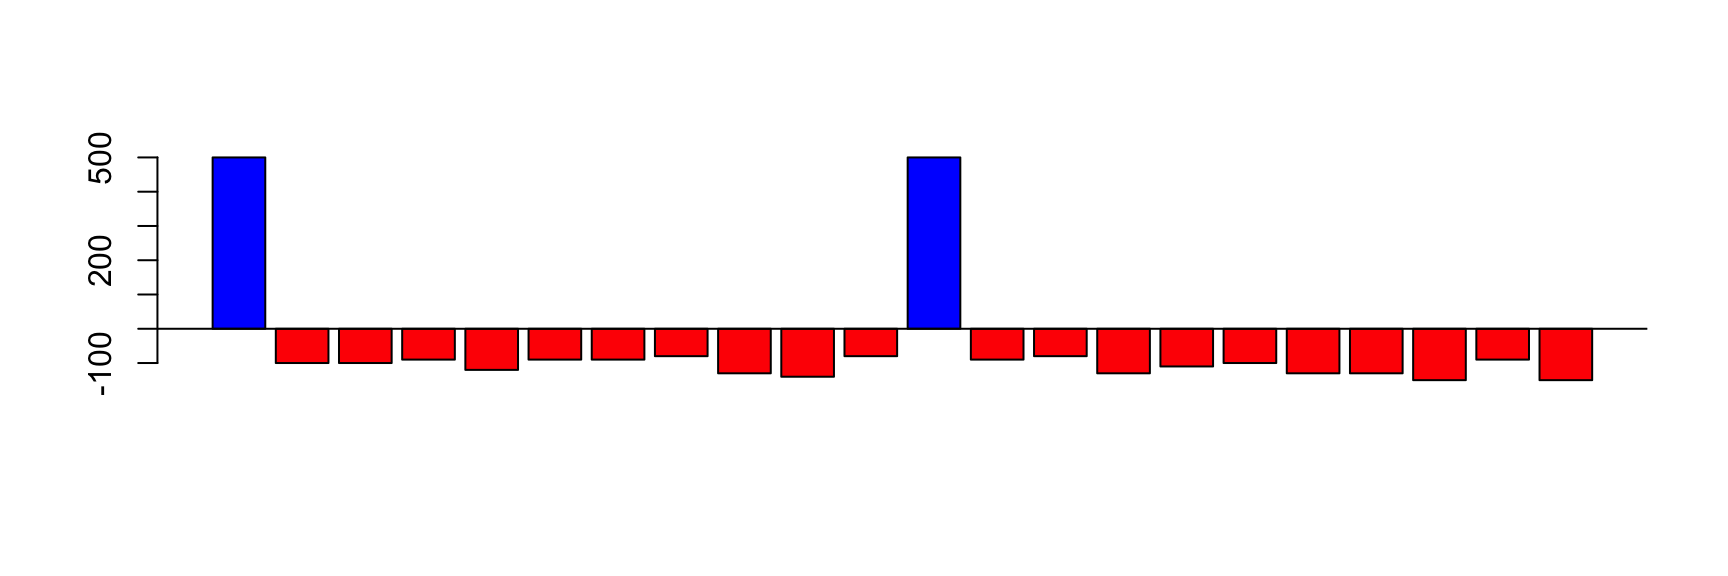
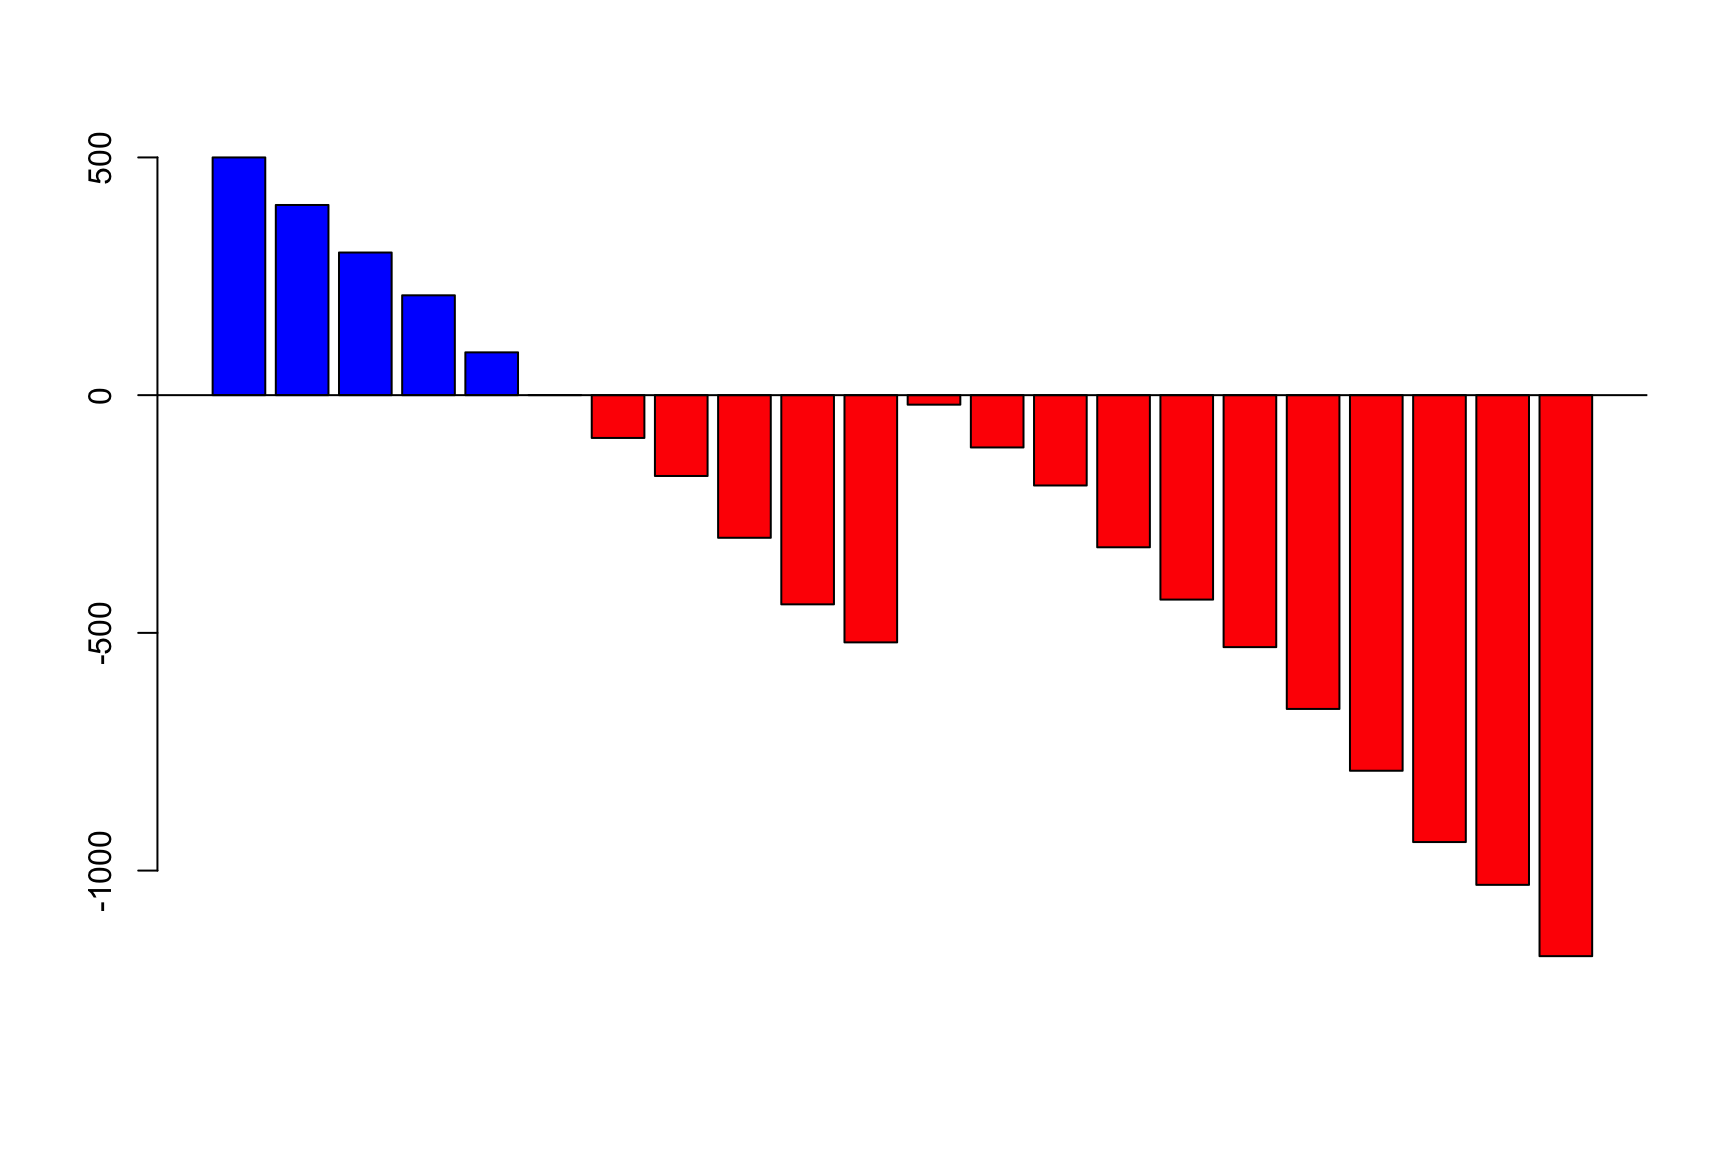
Skew and Cum_skew
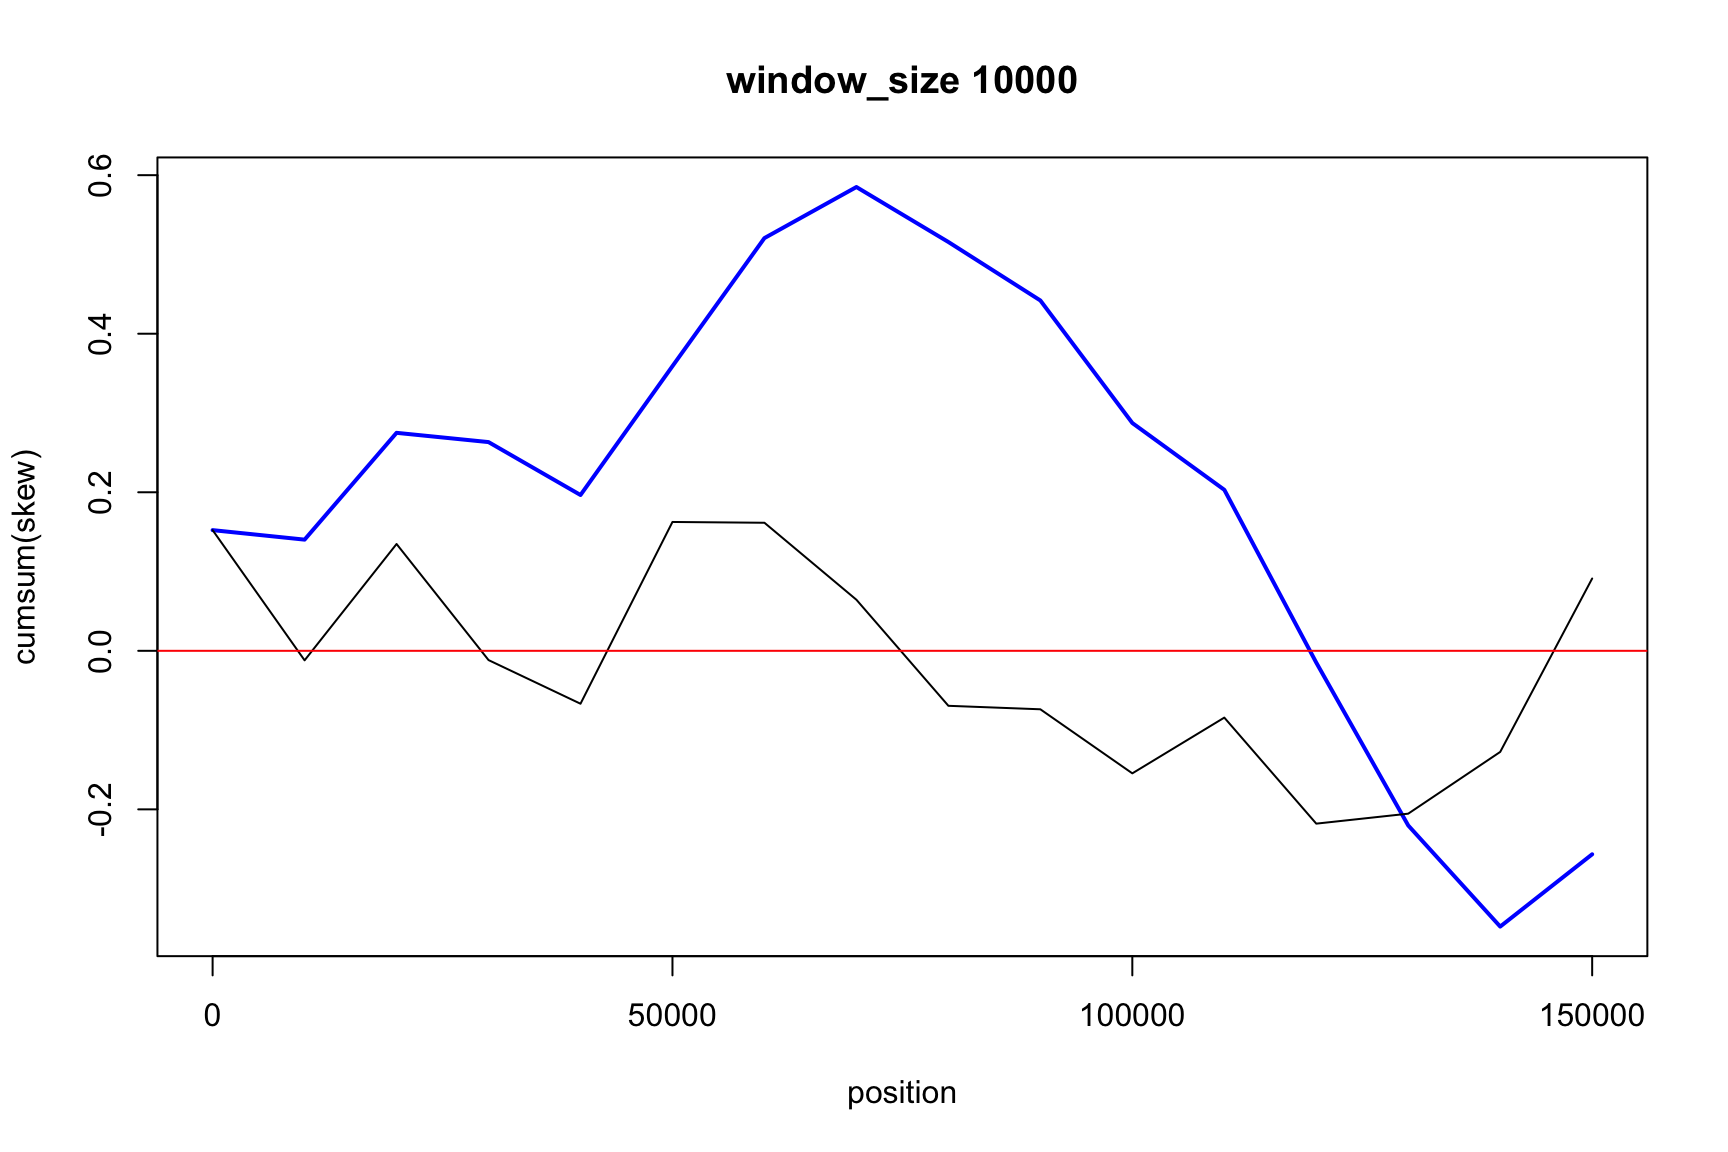
Skew and Cum_skew
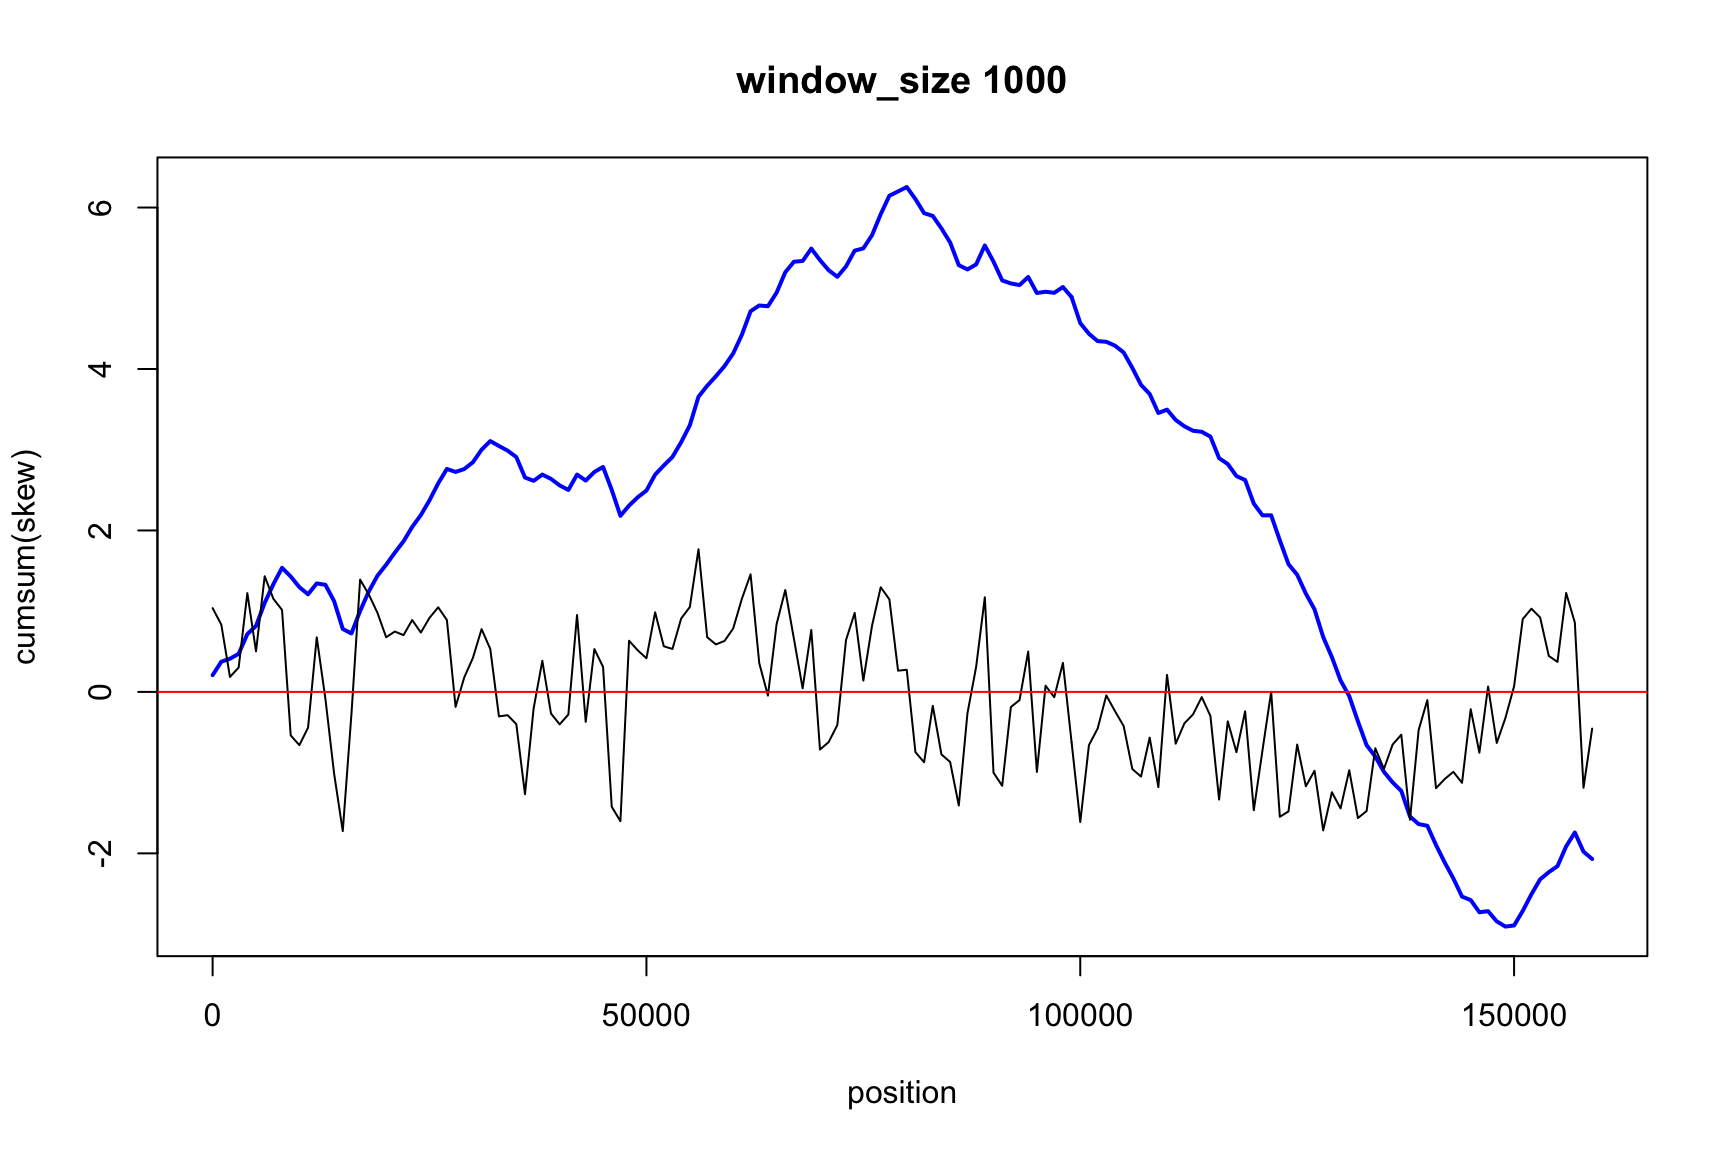
Skew and Cum_skew
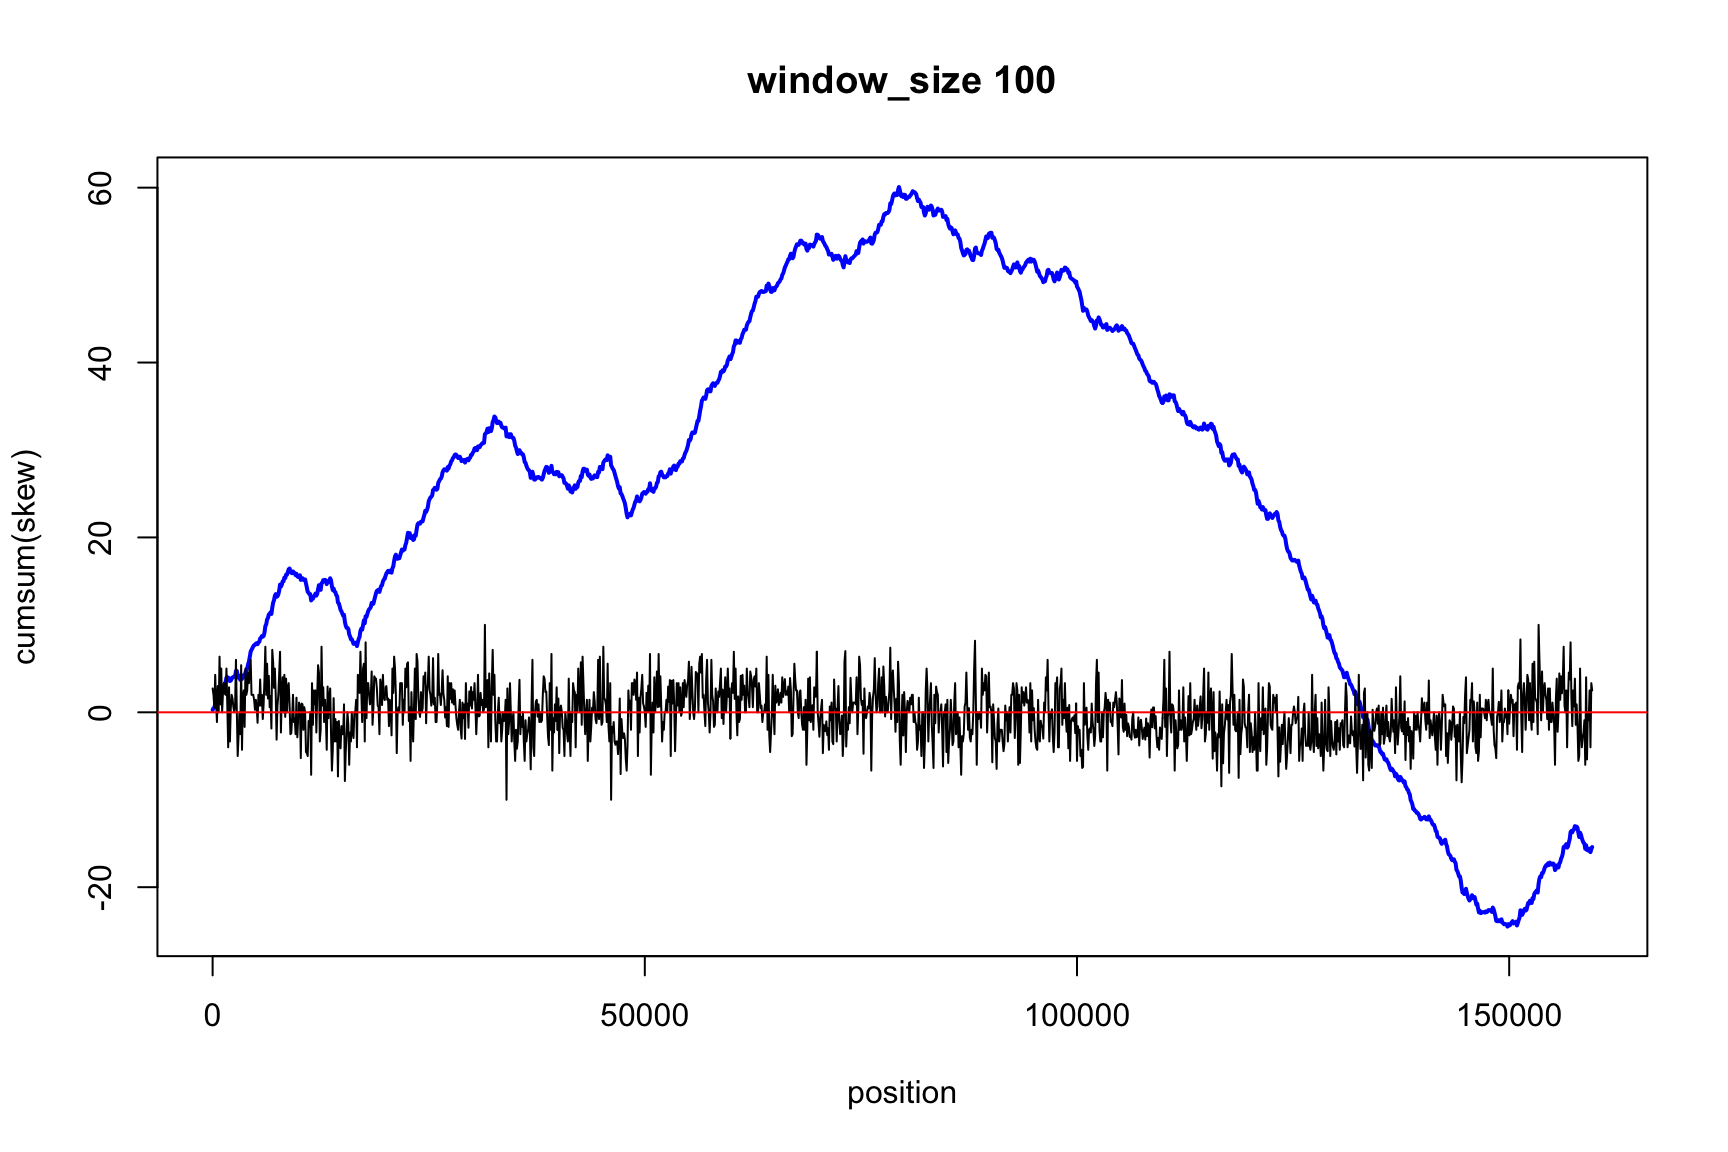
Skew and Cum_skew
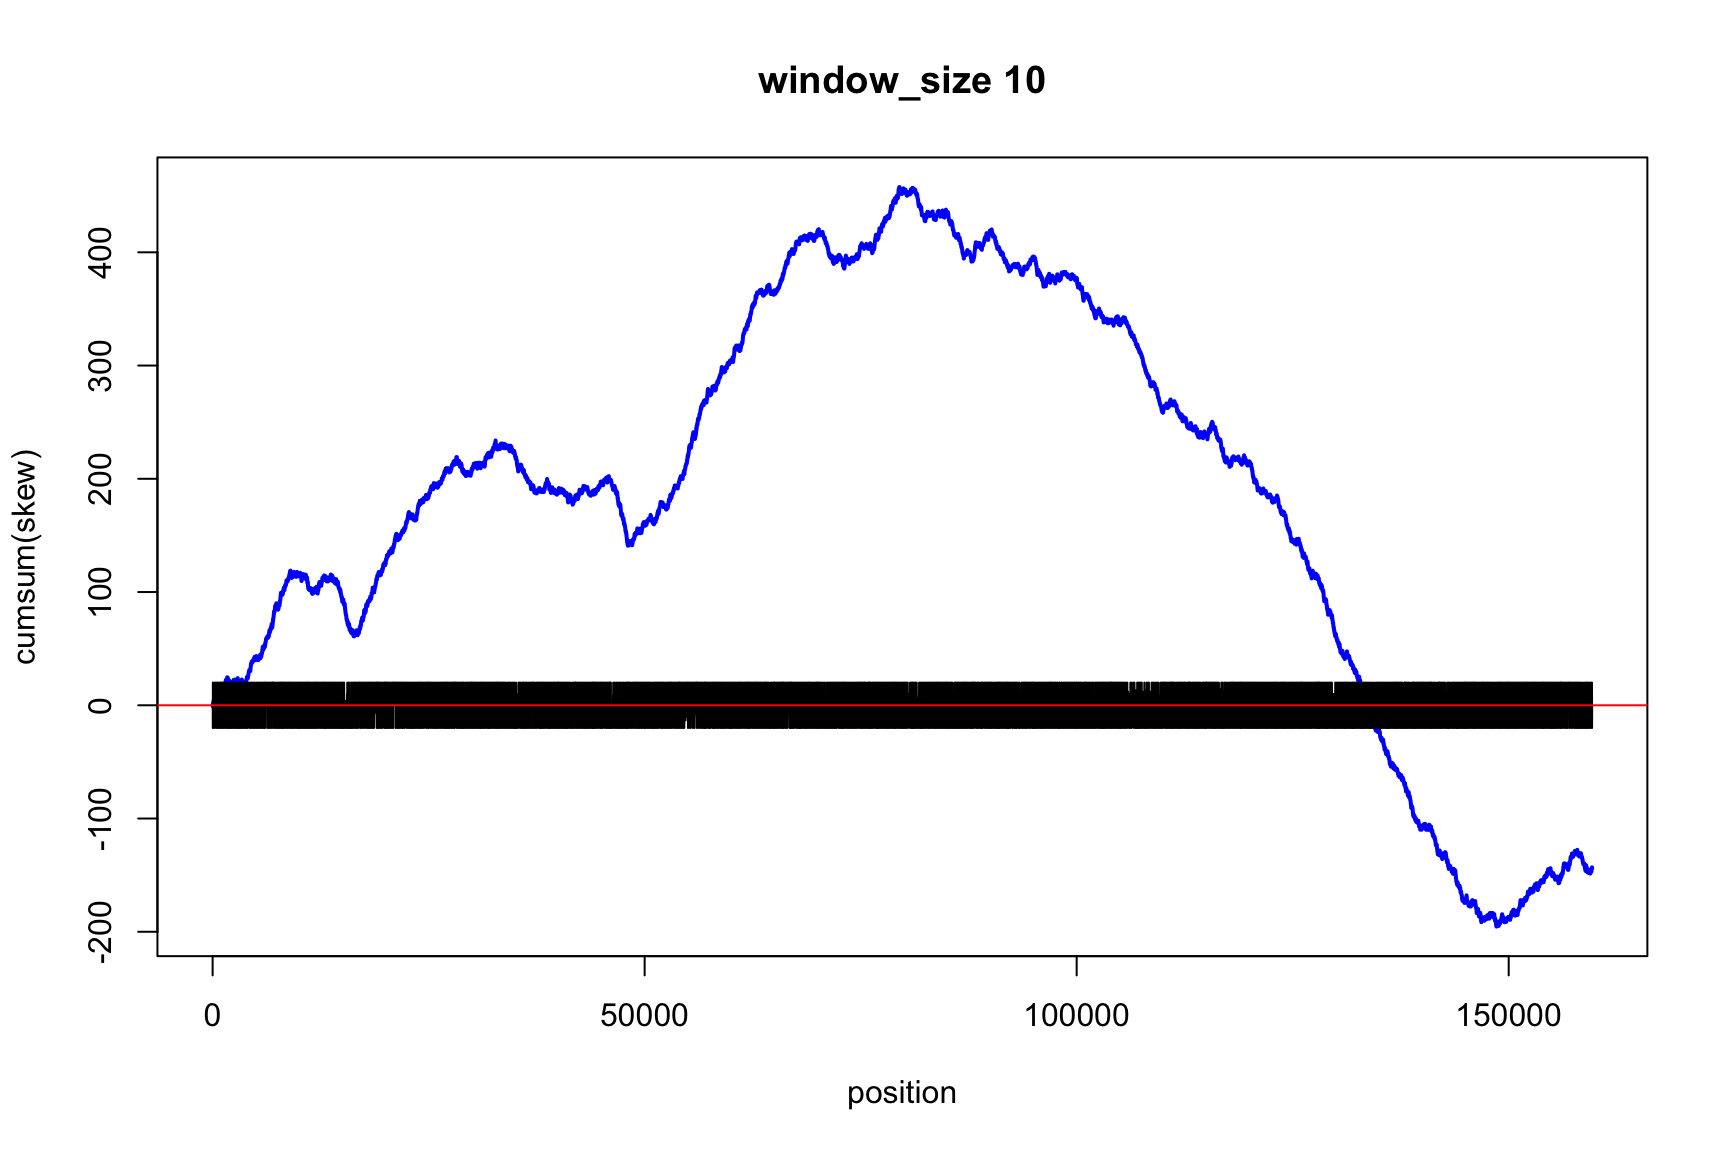
How small can window_size be?
We can make the window very small
If window_size=1,
How would be skew and cum_skew?
One window = one nucleotide
If window_size=1 then we don’t need windows
Instead we use a simple rule
- If
dna[i]=="g"thenskew[i] <- 1 - If
dna[i]=="c"thenskew[i] <- -1 - If
dna[i]=="a"ordna[i]=="t"thenskew[i] <-0
How you do that in R?
skew changes fast, cum_skew changes slow

Let’s do the same with AT-skew

Last two plots depend on position
First plot is GC-skew versus Position
Second plot is AT-skew versus Position
What is the relationship between GC-skew and AT-skew?
How can you show it?
GC-skew v/s AT-Skew
Have we seen this before?

What else can we do?
- If we know the income, we can get balance
- If we know the skew, we can get cum_skew
- If we know the change, we can know the state
Basic Systems Theory
These ideas are useful to understand the reality
A System is a set of parts that interact
Each part can be a smaller system
The behavior of the system depends on the parts AND on the interactions
Total is bigger than the sum of the parts
Complex systems can have emergent properties
That is, the system can do things that the parts cannot
The system is different than each of the parts
A simple system: growing cell lines
In a Petri dish we have two cells
Every hour, half of the cells replicate, and they never die
How many cells we have after i hours?
The parts of the system
There is only one element: the cells
There are two values important to them:
- The number of cells
- The change in the number of cells
Let’s give them names
The vector ncells is the number of cells
The value ncells[i] is the number of cells on time i
The vector growth is the growth of the number of cells
There are growth[i] new cells between time i-1 and i
Solving the system
Let’s simulate for 100 hours
First we create empty vectors to store the result
ncells <- rep(NA, 100)
growth <- rep(NA, 100)
Then we start with 2 cells and no growth
ncells[1] <- 2
growth[1] <- 0
Every hour, half of the cells replicate
growth[i] <- ncells[i-1]/2
The growth on time i depends on the cells existing on time i-1
The income of today depends on the balance of yesterday
The number of cells increases
ncells will be the cumulative sum of growth
But growth depends on ncells
Therefore, we have to calculate both together
Then, time goes by
How many cells we have after 100 hours?
for(i in 2:100) {
    growth[i] <- ncells[i-1]/2
    ncells[i] <- ncells[i-1] + growth[i]
}
ncells[100]
[1] 5.420816e+17
Plot

Limited food
In practice cells never grow that much
There is a limited amount of food
So the system has a second part: food
We represent it with the vector food
Cells eat food, food limits growth rate
Let’s say that initially food[1] <- 1E6
Each cell eats 1 food every hour: eaten[i] <- ncells[i-1]
Now growth depends on food:growth[i] <- ncells[i-1]*food[i-1]/1E6
What happens now?
Exercise
Make a program to simulate this system
What happens when food finish?
Is that realistic?