- Experiment
- If possible, we will do an experiment
- You need your cellphone’s camera
- Genomic databases
- Planets
December 3, 2018
Three parts
Free fall
- I will drop an object in front of the class
- The screen will show a timer
- You must record the experiment with your cellphone
- In your computer, open a new text file and write the experimental data
- three columns: seconds, position, and replica
- one row for each time the object crosses a mark
- Send your text file to
andres.aravena+cmb@istanbul.edu.tr
Example videos
YouTube has an option to show the video at 0.25 speed. Try that also
Second part
Genomic databases
Every time a researcher publishes a paper about DNA sequencing, all the sequences are uploaded to several databases.
One of these databases is https://www.ncbi.nlm.nih.gov/sra/
It contains all DNA reads made with New Generation Sequencers
We want to understand how fast this database is growing
Steps
- Download the file
sra_bases.txt - Create a new Rmarkdown document. Delete all unnecessary text
- do not forget to write your student number
- write the code to read the file into your document
- write the code to produce a plot like the one at https://www.ncbi.nlm.nih.gov/sra/docs/sragrowth/
The plot must look like this
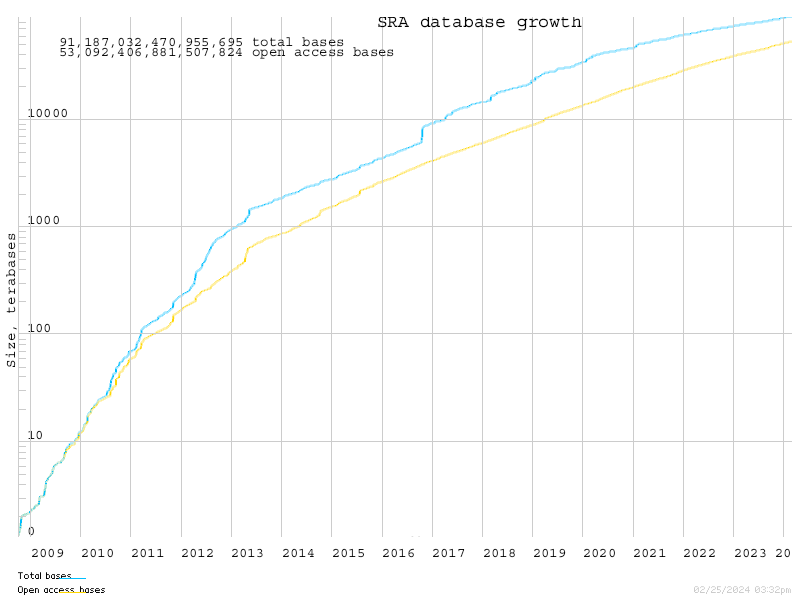
Database growth
- The growth of databases is usually modeled as a semi-log linear model.
- Build a semi-log model and find
- what is the factor of growth per day?
- What will be the database size two years after the last entry in your table?
- write your code and comments in the same Rmarkdown file
Third part
Planets
The file planets.txt contains the astronomical data for the planets in our solar system. The columns are:
- Name of the planet,
- Diameter in km,
- Distance to the sun in km,
- AU: distance to the sun in astronomical units, and
- Period of the orbits in days
We want to find the relationship between Period and Distance
Steps
- Download the file
planets.txt - In the same Rmarkdown document as the previous question, create a new section
- write the code to read the file into your document
- Draw three plots
- One using normal scales
- One using semi-log scales
- One using log-log scales
Steps
- Based on the 3 plots, decide which is the best approach to use a linear model. Explain why you made that decision.
- Build the model and show the coefficients
- Compare your result with Kepler’s third law
Bonus
- Looking at the log-log plot, do you think that there is something missing?
- Find the Distance and Period for the “missing planet” between Mars and Jupiter
Delivery
You should send two files to andres.aravena+cmb@istanbul.edu.tr
- The text file with the first part
- The Rmarkdown file with the second and third part
You can send the files in a single email or in two separated ones
Put your student number in the subject
Enjoy!