The average number of times that a particular nucleotide is represented in a collection of reads
Average Depth is sometimes called Coverage
September 28th, 2018
The average number of times that a particular nucleotide is represented in a collection of reads
Average Depth is sometimes called Coverage
Percentage of bases that are sequenced a given number of times
The number of contigs depends on
GLNIn general L can be different for each read. In this simulation we will assume all reads have the same length
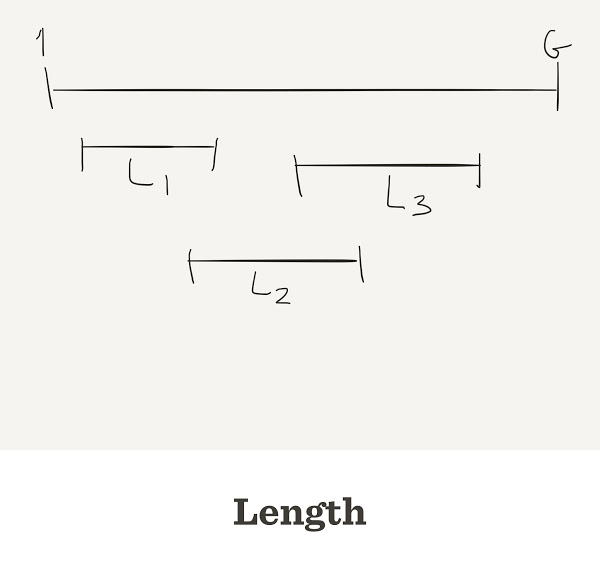
G, let’s say a virusG <- 1000
N of them, let’s say 10, each of length LN <- 10 L <- 100
The total number of nucleotides we got is
N*L
[1] 1000
Thus, the average depth (coverage) is
N*L/G
[1] 1
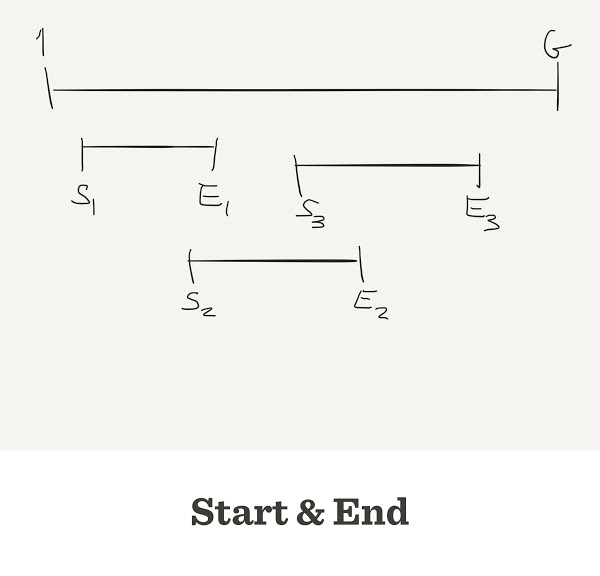
start and end position on the genomestart randomly, sort it, then we calculate endstart <- sample.int(G, size=N) end <- start + L
depth <- rep(0, G)
par(mar=c(7,4,2,2)+0.1)
plot(depth, type = "l", ylim=c(0,5))

read_pos <- start[1]:min(end[1], G)
depth[read_pos] <- depth[read_pos] + 1
plot(depth, type = "l")

for(i in 2:N) {
    # we assume Linear Chromosome
    read_pos <- start[i]:min(end[i], G)
    depth[read_pos] <- depth[read_pos] + 1
}
Sometimes end[i] can be greater than G. Then part of the read is outside the chromosome. We only see the inside part.
How would you handle a circular genome?
plot(depth, type = "l")

barplot(table(depth), xlab="depth",ylab="Num bases")
 If depth is 0, then we did not see that part of the genome
What percentage of the genome did we see?
sum(depth > 0) / G
[1] 0.659
In this case we use the theoretical value of G, since we do not know the real genome (yet)
What percentage of the genome has depth 2 or more?
sum(depth >= 2) / G
[1] 0.22