- GEO
- Entity - Relationship Models
- Accessing GEO from R
- Exercises with R
- Desired difficulty
- Error minimization
February 16, 2016
Content
GEO
What is GEO?
It is an international public repository that archives and distributes gene expression data submitted by the research community
- microarray,
- next-generation sequencing,
- and other forms of high-throughput functional genomics data
MIAME
Minimum Information About a Microarray Experiment
The minimum information that should be included when describing a microarray experiment.
Many journals and funding agencies require microarray data to comply with MIAME.
GEO encourage submitters to supply MIAME compliant data.
Critical elements in MIAME
with examples
- The raw data for each hybridization
- CEL or GPR files
- The final normalized data for the set of hybridizations
- the gene expression data matrix used to draw the conclusions from the study
- The essential sample annotation including experimental factors and their values
- compound and dose in a dose response experiment
Homework: Write down the new words or concepts and Google them
Critical elements in MIAME (cont)
- The experimental design including sample data relationships
- which raw data file relates to which sample,
- which samples are technical/biological replicates
- Sufficient annotation of the array
- gene identifiers, genomic coordinates,
- probe oligonucleotide sequences
- reference commercial array catalog number
- The essential laboratory and data processing protocols
- what normalization method was used
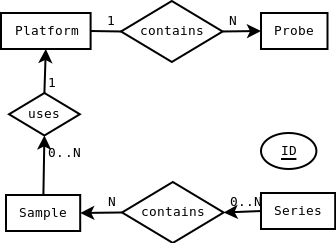
What is the Structure of GEO?
- Each author submits a series that contains one or more samples
- Each sample uses a platform to investigate one or more organisms
- Each platform has several probes to represent genes
All these entities are related to each other
Entity-Relationship modeling
GEO is an example of a pattern that is important in Data Science:
Data can have a structure that help us to manage and understand it
- The most common database systems are relational databases
- They store entities and relationships between them
Entity-Relationship modeling
- Entities: objects, nouns
- They exist independently of others
- They may have attributes
- Relationships: verbs
- connect two or more entities
- They may have attributes
Linguistic analysis
- Common noun: entity type, class
- proper noun: entity, instance
- verb: relationship
- adjective: attribute for entity
- adverb: Attribute for relationship
Eg. The genes of an organism have expression levels that depending on the growth medium
Example
The genes of an organism have expression levels that depending on the growth medium
Entities and their attributes
- genes: name, location
- organisms: scientific name
- growth medium: concentration, temperature
Relationships and attributes
- each gene is expressed under a growth medium
- the expression has a level
Cardinality
It is important to declare the possible number of relationships for each entity instance
For a given relationship between entities A and B
- Are all instances in A related to at least one instance of B?
- Can any instance of A be related to several instances of B?
Technical names: Surjective and Injective relationships. Check them
Cardinality example
The genes of an organism have expression levels that depending on the growth medium
- one organism has one or more genes
- each gene belongs to one and only one organism
- each gene has only one expression level on each growth medium
Accession Keys or Identifiers
Each instance of an entity should have an attribute to identify it
- Think of a “T.C. Kimlik No” of the entity
- One and only one for each instance
- Not shared with another instance
- Stable: never changes
Is “given name” a good identifier for a person?
Visualization
Alternative Visualization
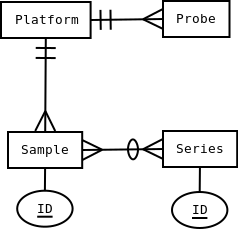
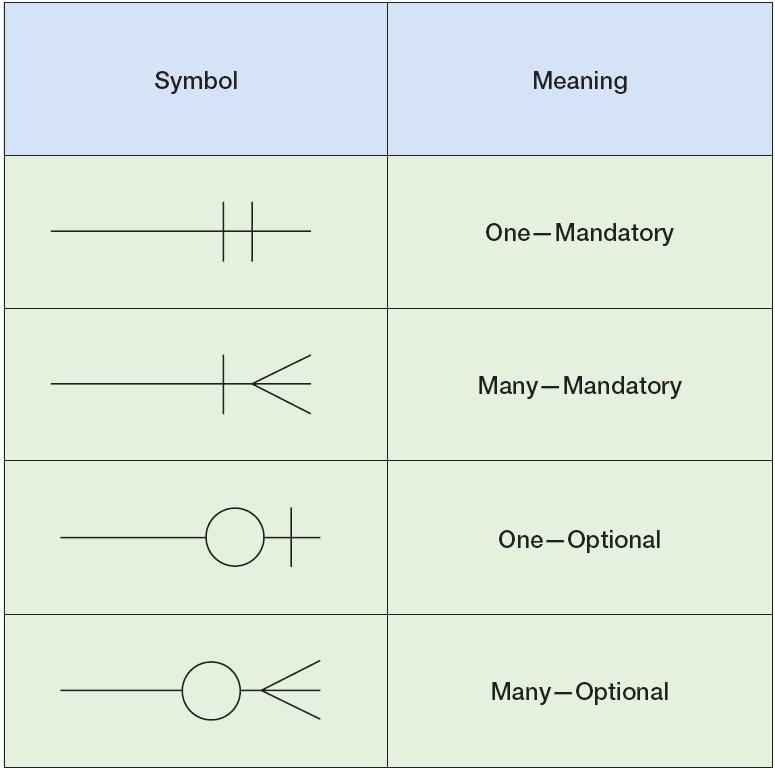
Crow’s foot
Homework
Identify the entities and relationships on the following cases.
Draw E-R diagrams for each of them
- You as student of Istanbul University
- Human cells
- Streets of Istanbul
- Your class schedule
GEO
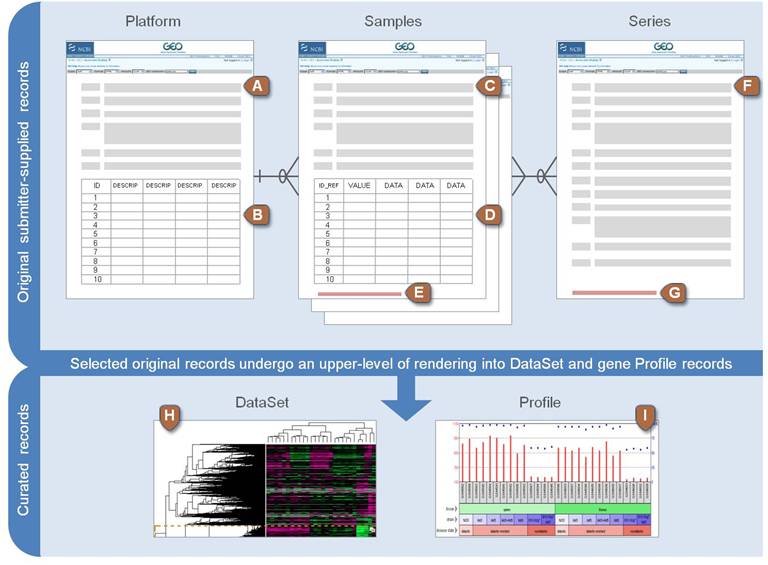
Platform records are supplied by submitters
A Platform record is composed of a summary description of the array or sequencer and, for array-based Platforms, a data table defining the array template.
- Text description of the array or sequencer
- Text tab-delimited table of the array template
Each Platform record is assigned a unique and stable GEO accession number (GPLxxx).
A Platform may reference many Samples that have been submitted by multiple submitters.
Samples are supplied by submitters
Describe how a single sample was handled, the manipulations it underwent, and the abundance measurement of each element derived from it.
Each Sample record is assigned a unique and stable GEO accession number (GSMxxx).
A Sample entity must reference only one Platform and may be included in multiple Series.
- Text description of the biological sample and protocols to which it was subjected
- Text tab-delimited table of processed hybridization result
- Original raw data file, or processed sequence data file
Series are supplied by submitters
A Series record links together a group of related Samples and provides a focal point and description of the whole study.
- Text description of the overall experiment
- Tar archive of original raw data files, or processed sequence data files
Series records may also contain tables describing extracted data, summary conclusions, or analyses.
Each Series record is assigned a unique and stable GEO accession number (GSExxx).
DataSet are made by GEO curators
- A curated collection of biologically and statistically comparable GEO Samples
- forms the basis of GEO’s suite of data display and analysis tools.
- Samples within a DataSet refer to the same Platform
- they share a common set of array elements
- Value measurements for each Sample within a DataSet are assumed to be calculated in an equivalent manner
- considerations such as background processing and normalization are consistent across the DataSet.
- Information reflecting experimental factors is provided through DataSet subsets.
Profiles are derived from DataSets
A Profile consists of the expression measurements for an individual gene across all Samples in a DataSet. Profiles can be searched using the GEO Profiles interface.
For more information, see About GEO Profiles page.
GEO into R
How do we read GEO data into R?
Ask Google
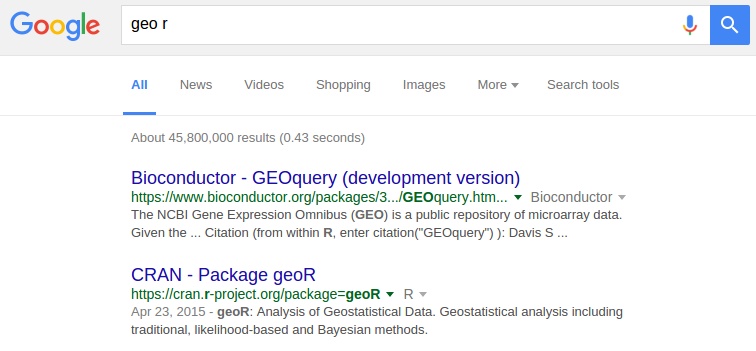
Notice that the second answer is not related to us
R packages
Remember that R can be extended with packages
- First we download (once) the files of the package
- When needed we load into the session using
library(package)
Anybody can make new packages. Most of them are found in a repository
- CRAN
- Bioconductor
Bioconductor
A set of libraries used to analyze molecular biology results
GEOquery is a package found in Bioconductor
Please follow the instructions on the webpage to install this package
The getGEO function
getGEO(GEO = NULL, filename = NULL, destdir = tempdir(), GSElimits=NULL,
GSEMatrix=TRUE, AnnotGPL=FALSE, getGPL=TRUE)
- GEO: A character string representing a GEO object for download and parsing.
- eg.
GDS2225,GSE3541,GSM81022,GPL341
- eg.
- filename: The filename of a previously downloaded GEO SOFT format file.
- Either one of GEO or filename may be specified, not both.
- destdir: The destination directory for any downloads. Defaults to a temporal dir.
- You may want to specify a different directory if you want to save the file for later use.
- Doing so is a good idea if you have a slow connection, as some of the GEO files are HUGE!
Homework
Reading microarray data from GEO
- Always use
destdirparameter to avoid excessive Internet usage - use RStudio Environment pane to examine the components of the resulting object
- Read the series GSE3541
- which are the samples?
- which is the platform?
- do you need to download the platform?
- which are the genes?
Practice at home. We will need this next week
Practice
Desired difficulty
A situation which
- makes something harder to learn initially
- harder to “encode”
- but makes it easier to recall and apply later
- easier to “retrieve”
“That a learning difficulty can be desirable in the long run is counterintuitive; students and instructors typically conflate immediate performance with longterm learning and therefore strive to avoid impediments to performance.”
Kolay Gelsin?
Many studies whow that doing things the easy way results in bad results
It is a good idea for manual and repetitive work
It is a very bad idea for creative and intellectual work
Remember: Thinking is like the gym
- It is hard if you don’t practice
- We are lazy and we avoid it
- We improve with practice
- Then we like it. And we look better
Error minimization
In statistics the word “error” does not mean “mistake”.
- Mistake is something we did wrong
- Error is the lack of precision even when we did everything right
Mistakes are about us. Errors are the difference between “models” and “reality”.
Errors in data summarization
If we have a vector x and we want to find a single value y to “represent” it, how do we choose y?
Since usually all x[i] are different, there will be an error if we represent them with a single y.
The best y will be the one which has the lowest error.
How do we measure this error?
Example
Measuring Error
For example, let’s consider the parity values from birth.txt
> x <- birth$parity
What is x?
> summary(x)
   Min. 1st Qu.  Median    Mean 3rd Qu.    Max.
  1.000   1.000   2.000   2.611   4.000   9.000
This result shows that x is a vector (why?)
Vectors and numbers
Now we choose any arbitrary value for y
> y <- 3
This is a single value, while x has many
> length(x)
[1] 694
> length(y)
[1] 1
Measuring each error
What is x-y?
> summary(x-y)
   Min. 1st Qu.  Median    Mean 3rd Qu.    Max.
 -2.000  -2.000  -1.000  -0.389   1.000   6.000
> length(x-y)
[1] 694
So, a vector minus a number is still a vector
But the error should be a positive number. Let’s try again
Measuring each error
What is (x-y)*(x-y)?
> summary( (x-y)*(x-y) )
   Min. 1st Qu.  Median    Mean 3rd Qu.    Max.
  0.000   1.000   1.000   2.703   4.000  36.000
> length( (x-y)*(x-y) )
[1] 694
So, a vector times itself is still a vector
And now all numbers are all positives
Total error
Let’s average all the individual errors to get a mean error
> mean( (x-y)*(x-y) )
[1] 2.70317
This is the Mean Quadratic Error of y=3 respect to x
How can we generalize this for different values of y?
Functions
In Math and Informatics, a function is a “black box”

A rule to transform the input elements into an output
- e.g. logarithm of a number, length of a vector
The same input should produce always the same output
Notice that there may be more than one input element
Functions in R
In R functions are a type of data. We have
- vectors
- matrices
- lists
- data.frames
- formulas
- functions
- and others
To create a function we need to asign it to a variable
Function syntax
> newFunc <- function(input) {
+   commands
+   commands
+   return(output)
+ }
The keyword return can be omitted. The function output is the result of the last command
Input values
- A function can get zero, one or several inputs
- They are mandatory, unless a default value is specified
- For example, if
> my.func <- function(a, b=2) {return(a*b)}
then
> my.func(3, 3)
[1] 9
> my.func(3)
[1] 6
What if the input is wrong?
> my.func()
Error in my.func(): argument "a" is missing, with no default
> my.func(1,2,3,4)
Error in my.func(1, 2, 3, 4): unused arguments (3, 4)
Exercises
Write a function
quadratic.error(y, x)- The
xinput should be optional with defaultbirth$parity Test it with different values of
y
> err <- quadratic.error(1.5)
What is err?
Apply a function
We would like to calculate the quadratic error for several values of y
For example,
> many.y <- seq(from=min(x), to=max(x), length.out=100)
Now we do
> err <- sapply(many.y, quadratic.error)
What is err?
How does it look
> plot(err ~ many.y, type="l")
 The best
 y is the one in the minimum
Minimum Quadratic Error
> min(err)
[1] 2.551838
> many.y[which.min(err)]
[1] 2.616162
> mean(x)
[1] 2.610951
How does it look
> plot(err ~ many.y, type="l")
> abline(v=many.y[which.min(err)])
> abline(v=mean(x))

Zoom
> plot(err ~ many.y, type="l", xlim=c(2, 3), ylim=c(0, 5))
> abline(v=many.y[which.min(err)])
> abline(v=mean(x))

Analitic approach
One common way to write the error as \[E(y) = \frac{1}{N}\sum_{i=1}^N (x_i-y)^2\] This is the same we wrote in r language
> mean((x-y)*(x-y))
or
> sum((x-y)*(x-y))/N
How do we find the minimum?
Homework
Show me your questions
Which concepts are not clear?
Show me your calendar
Home work
- Read the short story “Funes the Memorious” (by Argentine writer Jorge Luis Borges). You can find it on the web.
- There is a PDF in Turkish language. Google “Funes ve Sonsuz Bellek” and look on pages 111-119.
After reading it, do you want to have perfect memory? Why?
Practice the usage of GEOquery
We will use both on next class