April 26th, 2016
Welcome
to “Computing for Molecular Biology 2”
Plan for Today
- Sequence similarity
- What is the function of this gene?
- How do we find transcription factors?
- How do we find enzymes?
- and the reactions they catalyze?
- Pairwise Sequence Alignment
- Optimal
- Global
- Local
Sequence evolution
DNA replication is not perfect. Some bases can change
- Substitution of nucleotides
- Insertion of sequences
- Deletion of sequences
If these changes are lethal, the cell dies (by definition)
Therefore we only see changes that are compatible with cell life
This is one component of natural selection
Sequence and Function
Naturally, if two genes have the same sequence, they encode the same protein
If they differ in a few bases, the proteins will also differ a little, or less (why?)
So if two proteins are very similar, they probably do the same function
A few changes will probably not change they way it folds
Hypothesis: Same shape, same function.
Comparing sequences
Comparing two sequences using a dotPlot
A graphical method to compare two protein or DNA sequences and identify regions of close similarity between them.
A two-dimensional image, with the two sequences along the axes. The dotPlot displays a dot at points where there is an identical letter in the two sequences.
Reading dotPlots
- Individual cells are black if residues are identical, so that matching sequence segments appear as runs of diagonal lines across the matrix.
- Identical proteins will have a line exactly on the main diagonal of the dotPlot, that spans across the whole matrix.
- If they are not identical, but share regions of similarity, the dotPlot will have shorter lines that may be on the main diagonal, or off the main diagonal of the matrix.
- In essence, a dotPlot will reveal if there are any regions that are clearly very similar in two protein (or DNA) sequences.
Creating dotPlots
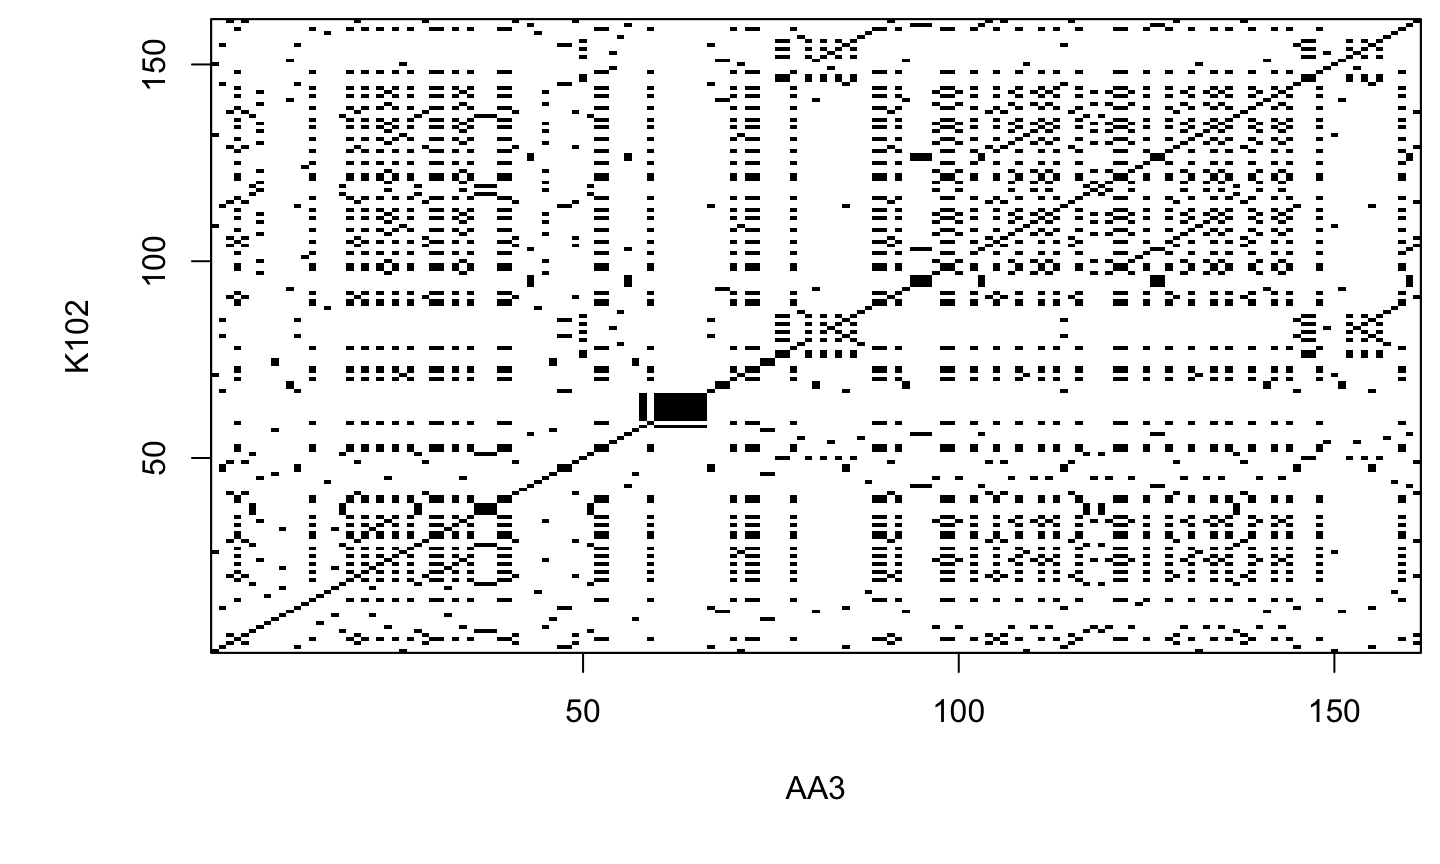
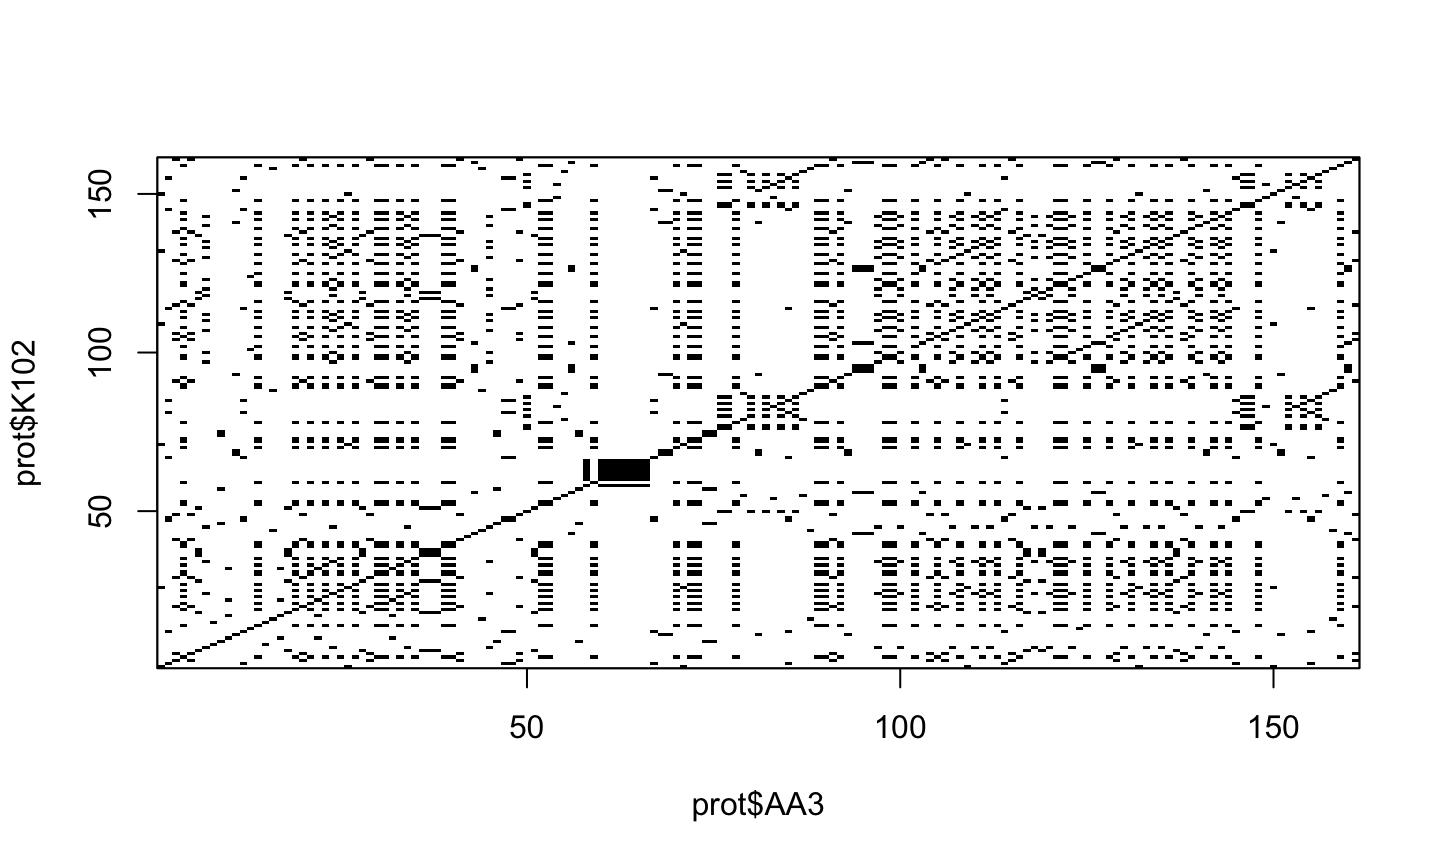
We can create a dotPlot for two sequences using the “dotPlot()” function in the SeqinR R package.
prot <- read.fasta("dehydrin.faa")
dotPlot(prot$AA3, prot$K102)
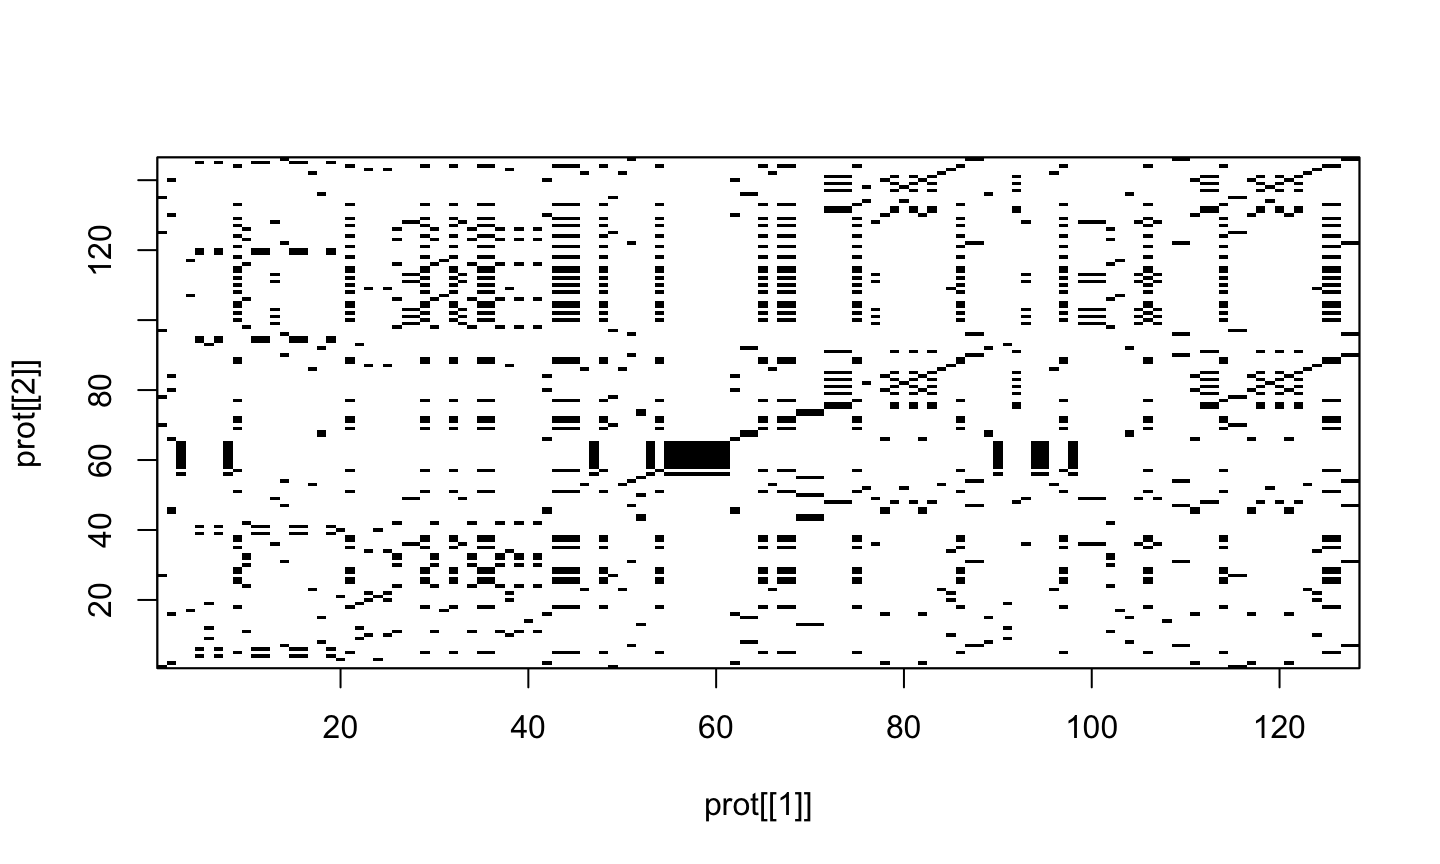
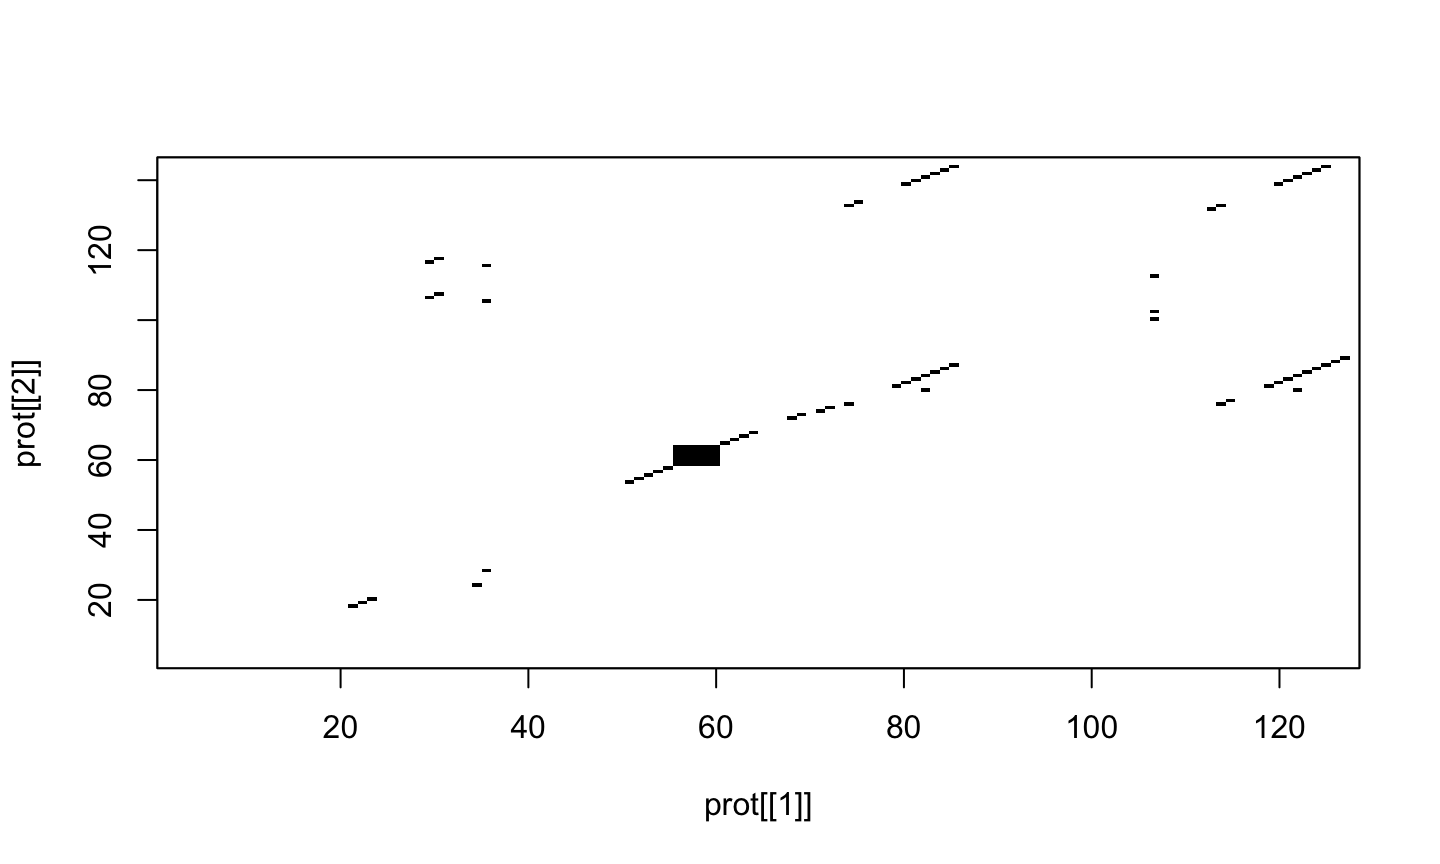
Another example
dotPlot(prot[[1]], prot[[2]])
Cleaning dotPlots
dotPlot(prot[[1]], prot[[2]], wsize = 2, nmatch = 2)
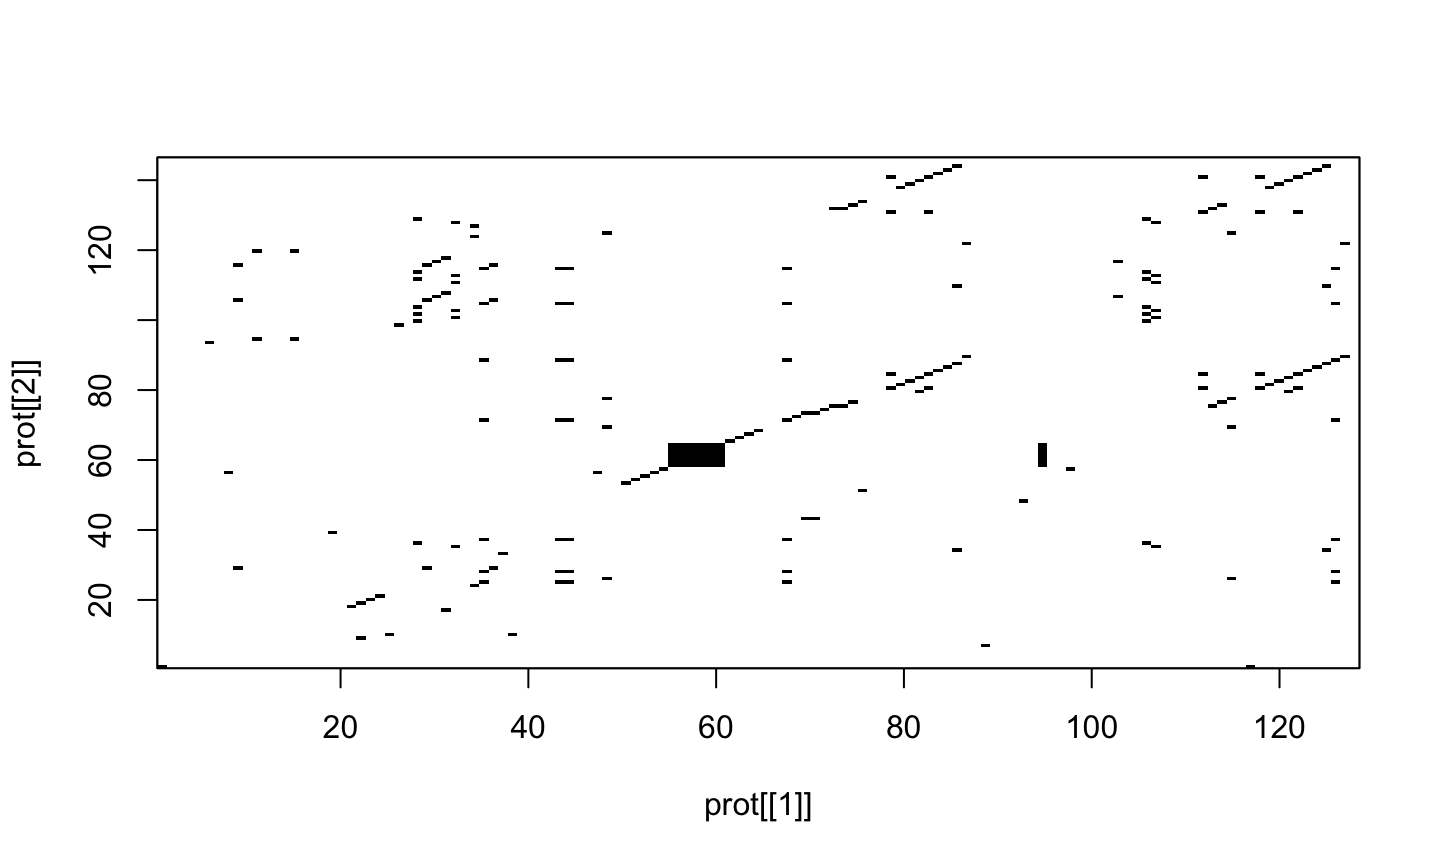
Even more clean
dotPlot(prot[[1]], prot[[2]], wsize = 3, nmatch = 3)
Exercise
Try on your own with different sequences
How do you interpret them?
Can you do it in Excel?
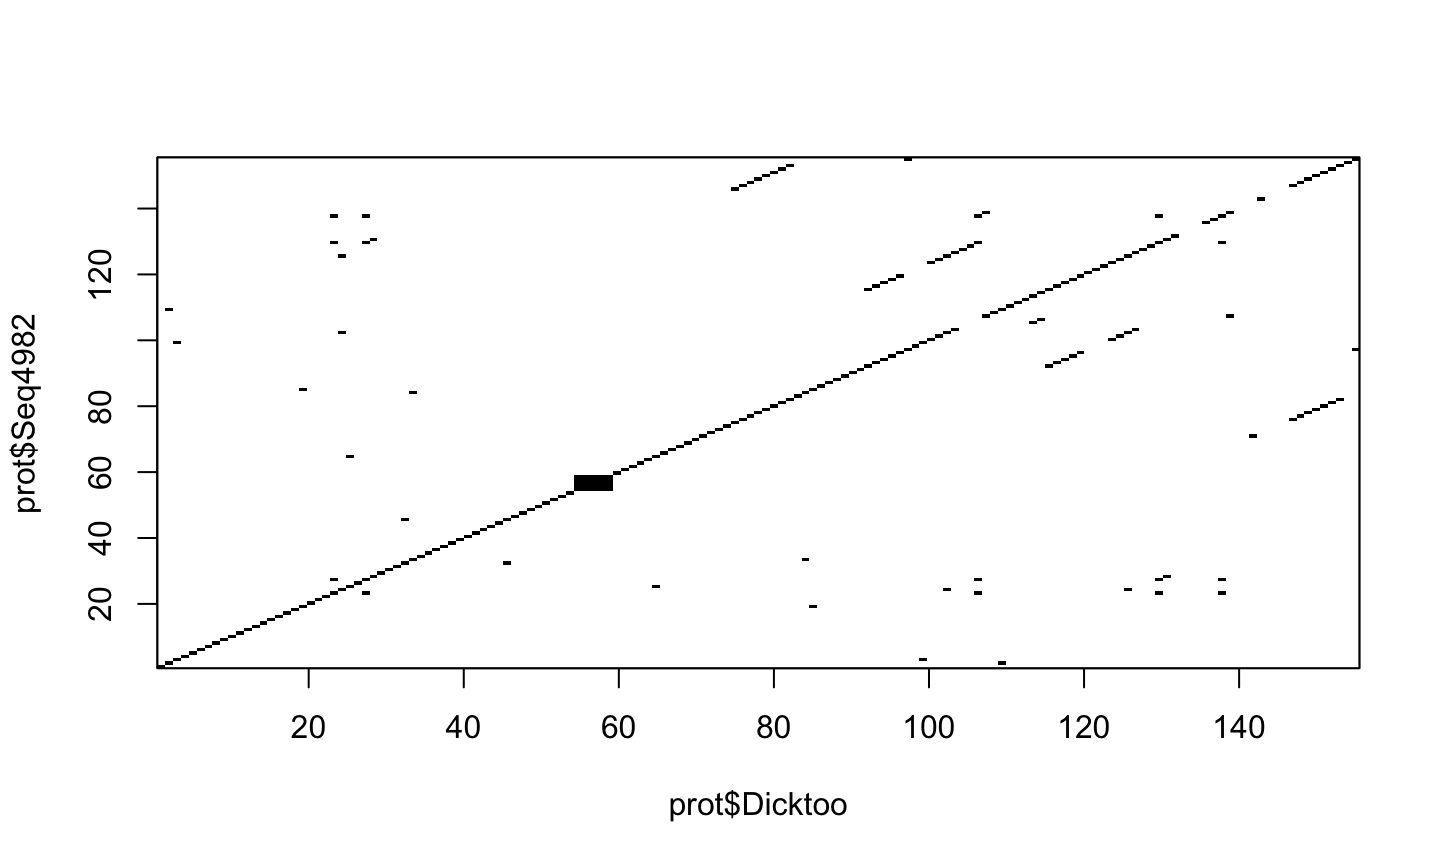
dotPlot(prot$Dicktoo, prot$Seq4982, wsize=3, nmatch=3)
dotPlot(prot$Dicktoo, prot$LK8, wsize=3, nmatch=3)
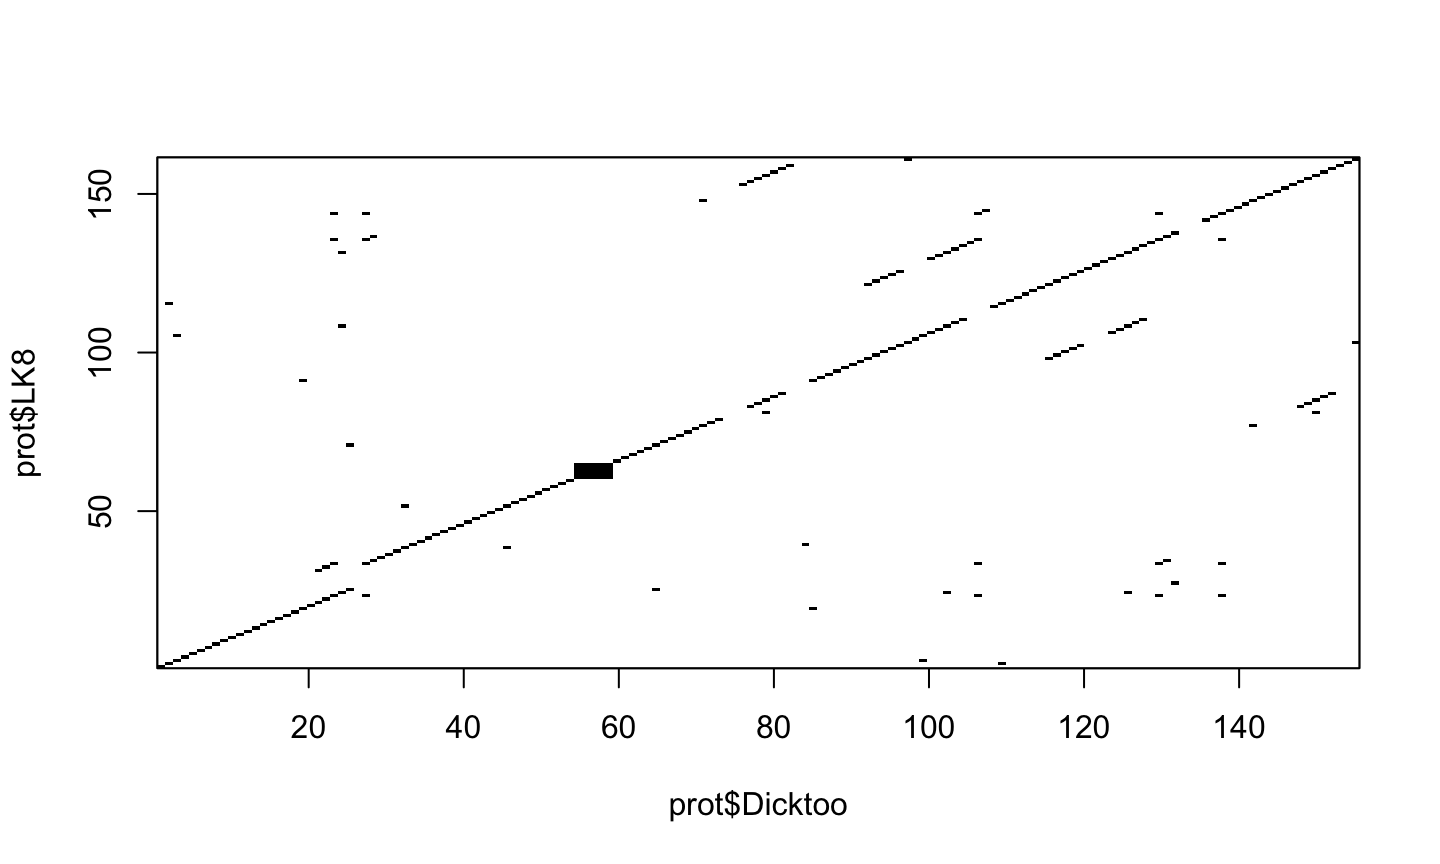
what does this mean?
Pairwise Alignment of Sequences
dotPlot shows a visual representation of the similarity between sequences.
The question is to what extent the two sequences are similar.
To quantify similarity, it is necessary to align the two sequences, and then you can calculate a similarity score based on the alignment.
Pairwise Alignment
To align two sequences we simply put each one in consecutive rows, inserting “gaps” if necessary to make them equal length. For example
G A A T T C
G A T T - A
Another option is
G A A T T C
G A - T T A
Which one is better?
Scoring of an Alignment
The first step in computing a alignment is to decide on a scoring system. For example, we may decide to give a score of +2 to a match and a penalty of -1 to a mismatch, and a penalty of -2 to a gap. Thus, for the alignment:
G A A T T C
G A T T - A
we would compute a score of 2 + 2 -1 + 2 -2 - 1 = 2. Similarly, the score for this
G A A T T C
G A - T T A
is 2 + 2 -2 + 2 + 2 -1 = 5:
Optimal Alignment
If there are several ways to align two sequences, which one do we choose?
An alignment is optimal if it has the maximum score.
That is, the optimal alignment has a score greater or equal to the scores of all possible alignments
There are “efficient” methods to find the optimal alginment
Scoring Matrix
The scoring system can be represented by a scoring matrix (also known as a substitution matrix).
The scoring matrix has one row and one column for each possible letter in our alphabet of letters (eg. 4 rows and 4 columns for DNA sequences).
The (i,j) element of the matrix has a value of +2 in case of a match and -1 in case of a mismatch.
We can make a scoring matrix in R by using the nucleotideSubstitutionMatrix() function in the Biostrings package.
Building a Scoring Matrix
The inputs for the nucleotideSubstitutionMatrix() function are the score that we want to assign to a match and the score that we want to assign to a mismatch.
We can also specify that we use only the four nucleotides (ie. A, C, G, T) by setting ‘baseOnly=TRUE’, or whether we also use the letters that represent ambiguous cases (eg. ‘N’ = A/C/G/T).
To make a scoring matrix which assigns a score of +2 to a match and -1 to a mismatch, and store it in the variable sigma, we type:
library(Biostrings)
Loading required package: methods
Loading required package: BiocGenerics
Loading required package: parallel
Attaching package: 'BiocGenerics'
The following objects are masked from 'package:parallel':

    clusterApply, clusterApplyLB, clusterCall, clusterEvalQ,
    clusterExport, clusterMap, parApply, parCapply, parLapply,
    parLapplyLB, parRapply, parSapply, parSapplyLB
The following object is masked from 'package:ade4':

    score
The following objects are masked from 'package:stats':

    IQR, mad, sd, var, xtabs
The following objects are masked from 'package:base':

    anyDuplicated, append, as.data.frame, cbind, colMeans,
    colnames, colSums, do.call, duplicated, eval, evalq, Filter,
    Find, get, grep, grepl, intersect, is.unsorted, lapply,
    lengths, Map, mapply, match, mget, order, paste, pmax,
    pmax.int, pmin, pmin.int, Position, rank, rbind, Reduce,
    rowMeans, rownames, rowSums, sapply, setdiff, sort, table,
    tapply, union, unique, unsplit, which, which.max, which.min
Loading required package: S4Vectors
Loading required package: stats4
Attaching package: 'S4Vectors'
The following object is masked from 'package:base':

    expand.grid
Loading required package: IRanges
Loading required package: XVector
Attaching package: 'Biostrings'
The following object is masked from 'package:seqinr':

    translate
The following object is masked from 'package:base':

    strsplit
sigma <- nucleotideSubstitutionMatrix(match = 2, mismatch = -1, baseOnly = TRUE)
sigma # Print out the matrix
   A  C  G  T
A  2 -1 -1 -1
C -1  2 -1 -1
G -1 -1  2 -1
T -1 -1 -1  2
Gap penalization
Instead of assigning the same penalty (eg. -8) to every gap position, it is common instead to assign a gap opening penalty to the first position in a gap (eg. -8), and a smaller gap extension penalty to every subsequent position in the same gap.
It is likely that adjacent gap positions were created by the same insertion or deletion event, rather than by several independent insertion or deletion events.
We don’t want to penalise a 3-letter gap as much as we would penalise three separate 1-letter gaps, as the 3-letter gap may have arisen due to just one insertion or deletion event, while the 3 separate 1-letter gaps probably arose due to three independent insertion or deletion events.
Global v/s Local alignment
There are two types of alignment in general.
A global alignment is an alignment of the full length of two sequences, for example, of two protein sequences or of two DNA sequences.
- Done with the Needleman-Wunsch algorithm
A local alignment is an alignment of part of one sequence to part of another sequence.
- Done with the Smith-Waterman algorithm
Doing the alignment
The pairwiseAlignment() function finds the score for the optimal global alignment between two sequences, given a particular scoring system.
The inputs are the two sequences that you want to align, the scoring matrix, the gap opening penalty, and the gap extension penalty.
You can also tell the function that you want to just have the optimal global alignment’s score by setting scoreOnly = TRUE, or that you want to have both the optimal global alignment and its score by setting scoreOnly = FALSE.
For example, to find the score for the optimal global alignment between the sequences GAATTC and GATTA, we type:
s1 <- "GAATTC"
s2 <- "GATTA"
globalAligns1s2 <- pairwiseAlignment(s1, s2, substitutionMatrix = sigma, gapOpening = -2,
    gapExtension = -8, scoreOnly = FALSE)
globalAligns1s2 # Print out the optimal alignment and its score
Global PairwiseAlignmentsSingleSubject (1 of 1)
pattern: [1] GAATTC
subject: [1] GA-TTA
score: -3
Note that we set gapOpening to be -2 and “gapExtension” to be -8, which means that the first position of a gap is assigned a score of \[(-8-2=)-10\] and every subsequent position in a gap is given a score of -8. Here the alignment contains four matches, one mismatch, and one gap of length 1, so its score is \[(4\times 2)+(1\times -1)+(1\times -10) = -3\]
Pairwise global alignment of protein sequences
To align proteins we need to use a scoring matrix for amino acids rather than for nucleotides.
There are several well known scoring matrices, such as the BLOSUM series of matrices.
BLOSUM with high numbers are designed for comparing closely related sequences, while BLOSUM with low numbers are designed for comparing distantly related sequences.
For example, BLOSUM62 is used for less divergent alignments (alignments of sequences that differ little), and BLOSUM30 is used for more divergent alignments (alignments of sequences that differ a lot).
Loading BLOSUM matrices
We can use the data() function to load a data set of BLOSUM matrices that comes with Biostrings package.
data(BLOSUM62)
BLOSUM62 # Print out the data
   A  R  N  D  C  Q  E  G  H  I  L  K  M  F  P  S  T  W  Y  V  B  J  Z  X
A  4 -1 -2 -2  0 -1 -1  0 -2 -1 -1 -1 -1 -2 -1  1  0 -3 -2  0 -2 -1 -1 -1
R -1  5  0 -2 -3  1  0 -2  0 -3 -2  2 -1 -3 -2 -1 -1 -3 -2 -3 -1 -2  0 -1
N -2  0  6  1 -3  0  0  0  1 -3 -3  0 -2 -3 -2  1  0 -4 -2 -3  4 -3  0 -1
D -2 -2  1  6 -3  0  2 -1 -1 -3 -4 -1 -3 -3 -1  0 -1 -4 -3 -3  4 -3  1 -1
C  0 -3 -3 -3  9 -3 -4 -3 -3 -1 -1 -3 -1 -2 -3 -1 -1 -2 -2 -1 -3 -1 -3 -1
Q -1  1  0  0 -3  5  2 -2  0 -3 -2  1  0 -3 -1  0 -1 -2 -1 -2  0 -2  4 -1
E -1  0  0  2 -4  2  5 -2  0 -3 -3  1 -2 -3 -1  0 -1 -3 -2 -2  1 -3  4 -1
G  0 -2  0 -1 -3 -2 -2  6 -2 -4 -4 -2 -3 -3 -2  0 -2 -2 -3 -3 -1 -4 -2 -1
H -2  0  1 -1 -3  0  0 -2  8 -3 -3 -1 -2 -1 -2 -1 -2 -2  2 -3  0 -3  0 -1
I -1 -3 -3 -3 -1 -3 -3 -4 -3  4  2 -3  1  0 -3 -2 -1 -3 -1  3 -3  3 -3 -1
L -1 -2 -3 -4 -1 -2 -3 -4 -3  2  4 -2  2  0 -3 -2 -1 -2 -1  1 -4  3 -3 -1
K -1  2  0 -1 -3  1  1 -2 -1 -3 -2  5 -1 -3 -1  0 -1 -3 -2 -2  0 -3  1 -1
M -1 -1 -2 -3 -1  0 -2 -3 -2  1  2 -1  5  0 -2 -1 -1 -1 -1  1 -3  2 -1 -1
F -2 -3 -3 -3 -2 -3 -3 -3 -1  0  0 -3  0  6 -4 -2 -2  1  3 -1 -3  0 -3 -1
P -1 -2 -2 -1 -3 -1 -1 -2 -2 -3 -3 -1 -2 -4  7 -1 -1 -4 -3 -2 -2 -3 -1 -1
S  1 -1  1  0 -1  0  0  0 -1 -2 -2  0 -1 -2 -1  4  1 -3 -2 -2  0 -2  0 -1
T  0 -1  0 -1 -1 -1 -1 -2 -2 -1 -1 -1 -1 -2 -1  1  5 -2 -2  0 -1 -1 -1 -1
W -3 -3 -4 -4 -2 -2 -3 -2 -2 -3 -2 -3 -1  1 -4 -3 -2 11  2 -3 -4 -2 -2 -1
Y -2 -2 -2 -3 -2 -1 -2 -3  2 -1 -1 -2 -1  3 -3 -2 -2  2  7 -1 -3 -1 -2 -1
V  0 -3 -3 -3 -1 -2 -2 -3 -3  3  1 -2  1 -1 -2 -2  0 -3 -1  4 -3  2 -2 -1
B -2 -1  4  4 -3  0  1 -1  0 -3 -4  0 -3 -3 -2  0 -1 -4 -3 -3  4 -3  0 -1
J -1 -2 -3 -3 -1 -2 -3 -4 -3  3  3 -3  2  0 -3 -2 -1 -2 -1  2 -3  3 -3 -1
Z -1  0  0  1 -3  4  4 -2  0 -3 -3  1 -1 -3 -1  0 -1 -2 -2 -2  0 -3  4 -1
X -1 -1 -1 -1 -1 -1 -1 -1 -1 -1 -1 -1 -1 -1 -1 -1 -1 -1 -1 -1 -1 -1 -1 -1
* -4 -4 -4 -4 -4 -4 -4 -4 -4 -4 -4 -4 -4 -4 -4 -4 -4 -4 -4 -4 -4 -4 -4 -4
   *
A -4
R -4
N -4
D -4
C -4
Q -4
E -4
G -4
H -4
I -4
L -4
K -4
M -4
F -4
P -4
S -4
T -4
W -4
Y -4
V -4
B -4
J -4
Z -4
X -4
*  1
Homework
Which other scoring matrices are used for protein alignment?
Hint: use data(package="Biostrings")
What is the biological meaning of these matrices? How are they built?
Aligning
To find the optimal global alignment between the protein sequences “PAWHEAE” and “HEAGAWGHEE” using the Needleman-Wunsch algorithm using the BLOSUM62 matrix, we type:
data(BLOSUM62)
s3 <- "PAWHEAE"
s4 <- "HEAGAWGHEE"
globalAligns3s4 <- pairwiseAlignment(s3, s4, substitutionMatrix = "BLOSUM62", gapOpening = -2,
    gapExtension = -8, scoreOnly = FALSE)
globalAligns3s4 # Print out the optimal global alignment and its score
Global PairwiseAlignmentsSingleSubject (1 of 1)
pattern: [1] P---AWHEAE
subject: [1] HEAGAWGHEE
score: -11