February 9, 2016
Welcome
to “Computing for Molecular Biology 2”
What is this about?
The previous course was “Introduction to Data Science”
- also know as “Computers are not typewriters”
This course is “Scientific Computing”
- a.k.a. “Computational Thinking”
- a.k.a. “Quantitative Thinking”
Why?
Because computers are essential tools for Molecular Biologists
They control the instruments
The help us to understand the results
They help us to design the experiments
We will focus on the last 2 items
Software as a Scientific Tool
“Scientists spend an increasing amount of time building and using software. However, most scientists are never taught how to do this efficiently”
“Software is as important to modern scientific research as telescopes and test tubes”
“…recent studies have found that scientists typically spend 30% or more of their time developing software…”
“We believe that software is just another kind of experimental apparatus and should be built, checked, and used as carefully as any physical apparatus”
Software skills are important
“However, […] most [scientists] do not know how reliable their software is. This can lead to serious errors impacting the central conclusions of published research”
“Recent high-profile retractions, technical comments, and corrections because of errors in computational methods include papers in Science, PNAS, the Journal of Molecular Biology, Ecology Letters, the Journal of Mammalogy, Journal of the American College of Cardiology, Hypertension, and The American Economic Review”.
Who said so?
Wilson et al. “Best Practices for Scientific Computing.” PLoS Biology 12,1 (2014)
- University of Ontario Institute of Technology, Canada
- Michigan State University, USA
- Space Telescope Science Institute, USA
- University of Toronto, Canada
- Monterey Bay Aquarium Research Institute, USA
- University of California Berkeley, USA
- University of British Columbia, Canada
- Queen Mary University of London,United Kingdom
- University College London, United Kingdom
- University of California Davis, USA
Quantitative Methods
Harvard Medical School
Modern biology increasingly requires computational and quantitative methods to collect, pro- cess, and analyze data, as well as to understand and predict the behavior of complex systems.
Whereas throughout much of the 20th century computational and mathematical biology were niche disciplines, their methods are now becoming an integral part of the practice of biology across all fields.
Stefan et al. “The Quantitative Methods Boot Camp: Teaching Quantitative Thinking and Computing Skills to Graduate Students in the Life Sciences”. PLoS Comput. Biol. 11, 1–12 (2015).
Learning Goals and Objectives
The authors say:
“We broadly categorize these goals into three domains”
- “thinking,”
- “doing”
- “feeling”
This reflects our belief that developing practical programming skills (“doing”) is of limited use if one does not also develop both the ability to think about problems algorithmically (“thinking”) and a positive attitude towards computing (“feeling”).
Thinking
Students will be able to
- recognize situations that call for computational methods
- conceptualize a problem so it becomes amenable to computational solution
- use simulations to build intuition about biological systems
- compare the outcome of simulations to real-world data
- formulate and test hypotheses
- understand a project as a collection of smaller parts
- plan steps needed to solve a problem
- think of ways to test the validity of a computational approach
Doing
Students will be able to
- import large datasets
- put them into appropriate computational structures
- visualize a dataset in multiple ways
- compute summary statistics
- use ideas of programming for problem-solving strategies
- use trial and error to design a computational approach
- read and understand documentation
- read and understand someone else’s code
- find and fix errors in a piece of code
- write a program to automatize data analysis
- document their code
Feeling
Students will
- appreciate the value of computational approaches
- feel confident about solving a computational problem
- persevere when they find a problem difficult
- recognize that successful coding can be fun as well as useful
- know when to ask for help and where to find support
- be willing and ready to learn more
- evaluate the quality of computational methods in science
- influence the work of others with examples of good practice
A short story
The Graybeard engineer retired and a few weeks later the Big Machine broke down, which was essential to the company’s revenue.
The Manager couldn’t get the machine to work again so the company called in Graybeard as an independent consultant.
Graybeard agrees. He walks into the factory, takes a look at the Big Machine, grabs a sledge hammer, and whacks the machine once whereupon the machine starts right up.
Graybeard leaves and the company is making money again.
Percusive Maintenance
The next day Manager receives a bill from Graybeard for $5,000.
Manager is furious at the price and refuses to pay. Graybeard assures him that it’s a fair price.
Manager retorts that if it’s a fair price Graybeard won’t mind itemizing the bill. Graybeard agrees that this is a fair request and complies.
Where is the value?
The new, itemized bill reads…
- Hammer: $5
- Knowing where to hit the machine with hammer: $4995

How will we do it?
A lot of practice
- Solving problems from Molecular Biology
- microarrays
- genome analysis
- experimental design
- Homework
- Each week we assign a subject
- Everybody prepares a 15-25 min presentation
- Someone is chosen randomly
- Graded
Structure
Structure in Data
Today we will focus on a key idea.
To understand the data we need structure
For example, in R we use data frames to represent tabular data. We also have lists containing any other element, incuding other lists. This is a hierarchical structure.
Folders in the disk are also a hierarchical structure. Tabular data can be stored in text files, with values in columns.
Structured documents
Text documents also have a logical structure
- Letters form words
- Several words become phrases and paragraphs
- Paragraphs are contained in sections and chapters
- Sometimes we have lists of elements
- Sometimes we have tabular data
- Figures
- References to other works
The problem
Ordinary word processors are based on the WYSIWYG (What You See Is What You Get) philosophy
Users are encouraged to change fonts, sizes, colors and other visual attributes
Separation of form and content
Writing and formatting at the same time is distracting.
The idea is to write first, and format later, as close as possible to the time of publication.
WYMIWYG (No, Not WYSIWYG)
While a word processor is the embodiment of the WYSIWYG (What You See Is What You Get) philosophy, LaTeX represents WYMIWYG—What You Mean Is What You Get. The information you enter defines the meaning of the document. The typesetting program, set up with enormous numbers of typesetting rules, then generates beautiful output for you.
The first mistake that most word processing programs make is that they don’t encourage the separation of style and content—some don’t even permit it. When I write, I structure my text in paragraphs. These are then assembled into sections, chapters, etc.
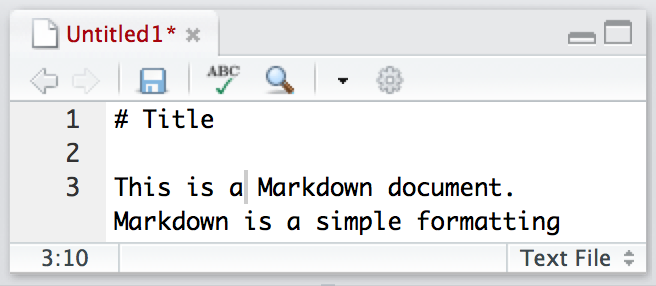
Markdown
An alternative to ordinary Word Processors is to use text files with a few rules to mark the role of each element.
Text files can be read with any computer, and will be accessible for ever.
Today the Structured text format more used is called Markdown
Here we show some of the rules
Emphasis
*italic*

**bold**
italic
bold
Headers
 # Header 1

 ## Header 2

 ### Header 3
Unordered List:
* Item 1
* Item 2
    + Item 2a
    + Item 2b
- Item 1
- Item 2
- Item 2a
- Item 2b
Ordered List:
1. Item 1
2. Item 2
3. Item 3
    + Item 3a
    + Item 3b
- Item 1
- Item 2
- Item 3
- Item 3a
- Item 3b
Links
Use a plain http address or add a link to a phrase:
<http://example.com>

[linked phrase](http://example.com)
Images
Images on the web or local files in the same directory:
 
Tables
|        | sample   | dose | time   | agent            |
|--------|----------|------|--------|------------------|
| 1      | GSM91440 | low  | 5 min  | caffeine         |
| 2      | GSM91893 | low  | 5 min  | caffeine         |
| 3      | GSM91428 | low  | 5 min  | calcofluor white |
| 4      | GSM91881 | low  | 5 min  | calcofluor white |
| sample | dose | time | agent | |
|---|---|---|---|---|
| 1 | GSM91440 | low | 5 min | caffeine |
| 2 | GSM91893 | low | 5 min | caffeine |
| 3 | GSM91428 | low | 5 min | calcofluor white |
| 4 | GSM91881 | low | 5 min | calcofluor white |
Computer code
```
this <- is.computer(code)
```
this <- is.computer(code)
Exercise
Create a Markdown document
- Choose
File -> New File -> Text File - Change the File type from “Text File” to “Markdown”
- Write the text in the following slide
Write in Markdown
How to solve it by G. Polya 
- You have to understand the problem.
- Find the connection between the data and the question. You may need to consider auxiliary problems. You should eventually obtain a plan of the solution.
- Carry out your plan.
- Examine the solution obtained.
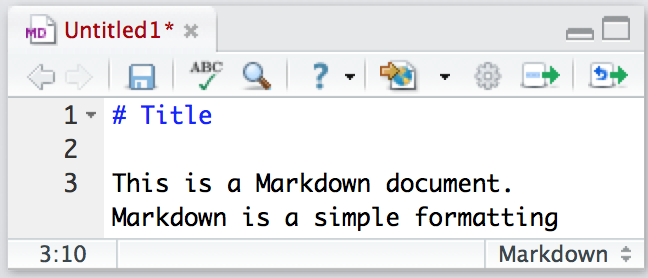
RMarkdown
Mixing text and code
RStudio incorporated a clever idea
- Code blocks can include real code
- Real code is marked by
{r} - Document metadata is included at the top of the document
Example
---
title: "Untitled"
output: html_document
---

This is an R Markdown document. Markdown is a simple formatting
syntax for authoring HTML, PDF, and MS Word documents.
For more details on using R Markdown see <http://rmarkdown.rstudio.com>.


```text
summary(cars)
```
Try by your own
Create a new “RMarkdown” document in RStudio
- Try the different options:
- HTML Document
- Word Document
- PDF Document
- Learn about the chunk parameters
- inside
{r}
- inside
- Create a slide presentation
Exercise
Create an HTML document that
- Loads the
birth.txtfile - Calculates the average and median parity
- Show that
- the average minimizes the quadratic error
- the median minimizes the absolute error
More from “How to Solve It”
Understanding the problem
- What is the question?
- What are the data?
- Find a way to visualize the problem.
- Introduce suitable notation.
- Separate the various parts of the question. Can you write them down?
Devising a plan
- Have you seen the problem before?
- Have you seen it in another form?
- Do you know a related problem?
- Can you restate the problem?
- Can you imagine a more accessible related problem?
- A more general problem?
- A more special problem?
- An analogous problem?
Devising a plan
- Can you solve part of the problem?
- Could you derive something useful from the data?
- Could you think of other data that can be useful?
- Did you use all the data?
- What do people normally do to obtain such a result?
- Persevere through unsuccess,
- appreciate small advances,
- wait for the essential idea,
- and then concentrate fully when it appears.
Carrying out the plan
- We may use heuristic approaches as we use scaffolding to support a bridge during construction.
- Progress is the mobilization and organization of our knowledge, the evolution of our conception of the problem, and increasing certainty of the solution plan.
- An increase in the completion of the connection between the data and the unknown is a sign of progress.
- The absence of signs helps save us effort while their presence can cause us to correctly concentrate our effort.
- It takes experience to learn to interpret signs correctly.
Looking back
- Can you check the result?
- Consider special cases of the result to see it they make sense.
- Can you check the argument?
- Introduce variation in your review of the problem to avoid stumbling in the same places.
- Can you derive the result differently?
- Can you use the result, or the method, for some other problem?
Keywords
Heuristics:
Argument:
Resources
Web Pages
Papers
Stefan, M. I., Gutlerner, J. L., Born, R. T. & Springer, M. “The Quantitative Methods Boot Camp: Teaching Quantitative Thinking and Computing Skills to Graduate Students in the Life Sciences”. PLoS Comput. Biol. 11, 1–12 (2015). doi:10.1371/journal.pcbi.1004208.
Wilson, G., D. a. Aruliah, C. T. Brown, N. P. Chue Hong, M. Davis, R. T. Guy, S. H. D. Haddock, et al. “Best Practices for Scientific Computing.” PLoS Biology 12, no. 1 (2014): e1001745. doi:10.1371/journal.pbio.1001745.
Noble, William Stafford. “A Quick Guide to Organizing Computational Biology Projects.” PLoS Computational Biology 5, no. 7 (2009): 1–5. doi:10.1371/journal.pcbi.1000424.
Homework
Next Week
Describe what can we get from NCBI.
It is big, so we will focus only in
- Gene Expression Omnibus (GEO)
- Taxonomy
Write your slides in RMarkdown