12 November 2014
A personal story
This is my last day as CMM researcher
- I’ve been working on bioinformatics since 2002,
- as head engineer of the Bioinfo Lab (MATHomics)
- as PhD student
- as CRG member
- in the research project CMM–BioSigma S.A.
Collaboration with BioSigma S.A.
Bioleaching bacteria.
We focused on several questions.
One of the key ones was:
understanding transcriptional regulation on A. ferrooxidansLimitations:
- Cell modification is not feasible
- Knock out is not feasible
Our Approach
Our Approach
Modeling regulation by integrating genomic and transcriptomic data.
- Microarray results for several stress conditions
- identification of co-expressed genes
- Annotated genomic sequence
- Identify putative Transcription Factors and Binding Sites.
Co-expression
Identification of sets of genes sharing similar behaviors through different environmental stresses:
- Mutual Information is used to evaluate non-linear co-expression \[I(A;B) = \sum_{a,b} P(a,b)\log\frac{P(a,b)}{P(a)P(b)}.\] where \(P(a)\) and \(P(b)\) are the probability distributions of the random variables associated to the expression profiles of genes \(A\) and \(B\). Their conjoint distribution is \(P(a,b)\).
Significant co-expression
- Statistical significance determined using Maximal Relevance/Minimal Redundancy criterion (MRNET).
- Several noise sources can affect the result
- Unmeasurable changes can affect regulation
- We assume that all genes in each operon are co-expressed
- This helps to simplify the analysis
Pairs of coexpressed operons
- Influence graphs: abstraction describing empirical co-expression between genes.
- They often do not represent physical interactions
- They cannot be interpreted causally.
- Even so, they convey information about the underlying transcriptional mechanisms.
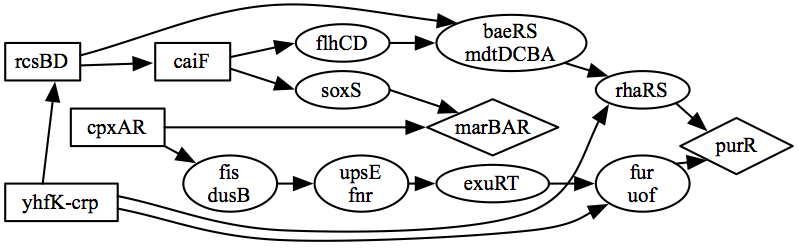
Physical Interaction networks
In contrast, a transcriptional regulatory network (TRN) corresponds to a physical model of the interactions
- from regulators: genes coding for Transcription Factors
- to target genes: those having a Binding Site for the TF in the promotor region
- some of them also acting as regulators
- Modulate the global expression of genes through regulatory cascades.
Model: Explaining co-expression
Co-expression is explained by the existence of a common regulator acting on them directly or indirectly through a regulatory cascade. Either:
- There is a directed path from one gene to the other. The first is regulating the last by a regulatory cascade.
- None of the genes is regulating the other but both are co-regulated by a third gene.
- This case is represented in the network by a v-shape: two paths from a common regulator to each co-regulated gene.
v-shapes
- For a given pair of co-regulated genes A and B, we want to find the possible explanations for their co-regulation.
- Thus, we call an explanation of A and B to any path from A to B or from B to A or any set of arcs forming a v-shape between them.
Using E.coli for model evaluation
Since A. ferrooxidans regulation data is scarce, we use E.coli as a test platform.
- Genomic sequence available
- 4523 genes, 2650 operons (as described in RegulonDB)
- Differential expression data available:
- 907 arrays in Many Microbe Microarrays Database (M3D)
- MRNET produces 61,506 pairs of coexpressed operons.
- Several experimentally proven regulations described in the literature
- RegulonDB 8.1 includes 1652 experimentally validated regulations between operons.
Experimental regulations explain few co-expressions
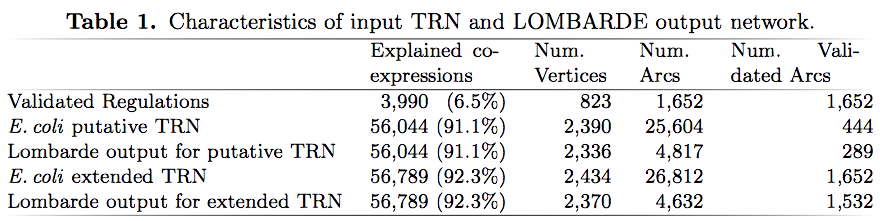
The network of experimentally validated regulations described in RegulonDB only explains 3,990 (6.5%) of the 61,506 observed co-expressions.
- Only a few co-expressions were explained by a single validated arc
- The rest could only be explained through regulatory cascades.
Predicted physical interactions can explain most co-expressions
A putative TRN was built using E.coli genomic sequence and patterns from Prodoric database of transcription factors and binding sites.
We found that this putative TRN explained 91.1% of the pairs of co-expressed operons.
Putative TRNs are usually huge
Putative TRNs are usually huge, due to the low specificity of methods based on the sequence.
- Predicted interactions may not be real regulations
- However the putative network describes most of the feasible physical interactions and must be able to explain co-expressions.
- The putative TRN contains regulatory interactions that explain most of the observed co-expressions by regulatory cascades
- A realistic network explaining the same co-expressions could be obtained as a subnetwork of it chosen in a biologically meaningful way. This is the main motivation of the strategy used by LOMBARDE.
Lombarde
Graphical Illustration
Overview of LOMBARDE
The LOMBARDE method requires for the studied organism (here a prokaryote) the following input:
- a putative TRN represented by a weighted directed graph \(\mathcal G\), with vertices corresponding to genes and arcs connecting regulator genes to regulated ones.
- An arc connects two genes if the first gene codes for a transcription factor that presumably binds in the promoting region of the second gene.
- The \(p\)-value \(p_i\) associated with this arc reflects the confidence level of this prediction.
- a set \(\mathcal O\) of pairs of co-expressed genes.
Overview of LOMBARDE
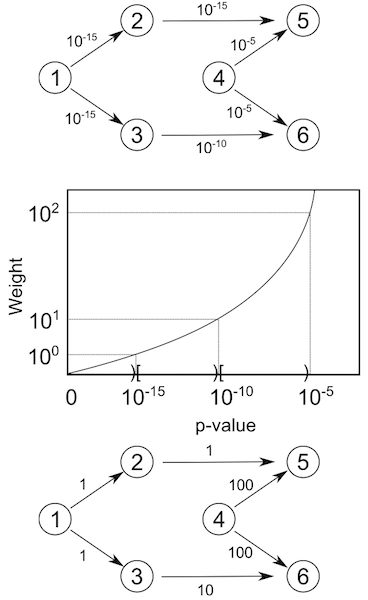
- In a first stage LOMBARDE assigns to each arc a discrete cost \(w_i\) in a way such that the more confident arcs have lower cost. \[w_i = F(p_i)\]
- LOMBARDE discretizes the \(p\)-values into \(k\) categories.
- This allows to define the function \(Cost(S)\) for any subgraph \(S\) as the sum of the costs of its arcs. \[Cost(S)=\sum_{i\in S}w_i\].
Overview of LOMBARDE
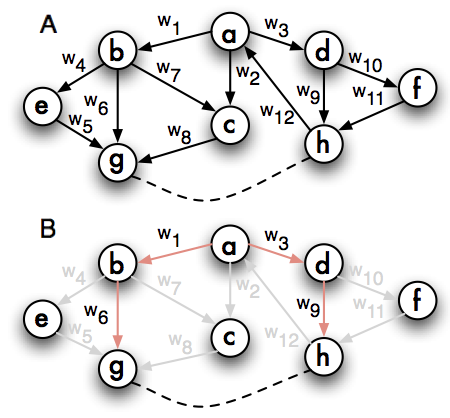
In a second stage LOMBARDE deciphers the co-expression of the pair \((gene_{1}, gene_{2})\in \mathcal O\) by identifying a common regulator \(gene_{3}\) which is connected to both \(gene_{1}\) and \(gene_{2}\) via regulatory cascades of high confidence.
In graph terms, a subgraph \(S\) is an explanation for the pair \((gene_{1}, gene_{2})\) if \(S\) is the union of two independent paths from \(gene_{3}\) (the common regulator) to \(gene_{1}\) and to \(gene_{2}\).
Confident explanations
An explanation for \((gene_{1}, gene_{2})\) is said to be confident if it is of minimum cost among all the explanations for the pair.
Our model transforms a parsimony cirteria into a graph minimization problem.
The output of LOMBARDE is a subgraph \(\mathcal L\) of \(\mathcal G\) built as the union of all confident explanations for each co-expressed pair in \(\mathcal O\).
Results
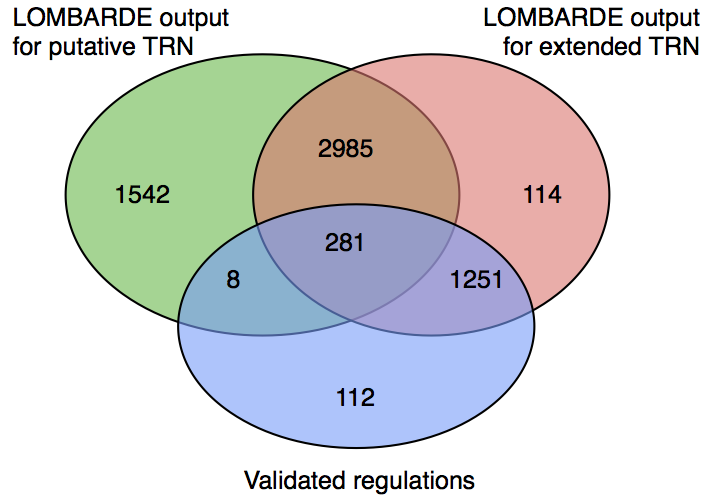
LOMBARDE results are biased towards validated regulatory interactions
The putative TRN for E.coli contains 25,604 arcs, 444 of them corresponding to experimentally validated arcs.
After applying LOMBARDE most of its arcs are discarded, keeping only 4,817 (18.8%).
However, among the validated arcs, LOMBARDE is less aggressive, keeping 289 (65.1%) of them.
This shows that the output of LOMBARDE is biased towards experimentally validated regulations.
- An hypergeometric test confirms this bias, with an enrichment \(p\)-value under \(10^{-105}\).
LOMBARDE can complete partially known TRN
- We also considered an extended TRN combining all E.coli validated regulations and all arcs in the putative TRN
- LOMBARDE kept 16.3% of the arcs in the putative TRN while preserving 92.0% of the experimentally validated arcs.
LOMBARDE is sensitive to the existence of true regulations in the TRN
We evaluate a little more the effect of an eventual improvement in the putative TRN prediction, we compared between the results of LOMBARDE applied to the original putative TRN and to the extended TRN for E.coli.
- There is a core subset of arcs shared between both results, corresponding to about 70% of the arcs of each TRN input.
- Interestingly, almost all validated regulations in the LOMBARDE output for the putative TRN are in this core (only eight are missing).
LOMBARDE is sensitive to the existence of true regulations in the TRN
- The effect of including all validated regulations in the input TRN is that near 30% of non-validated arcs are replaced by a set of similar size where almost all arcs are validated.
This shows that, using the current putative TRN prediction methods, LOMBARDE is capable of detecting a core of key regulations which explains the observed co-expressions, and confirms the bias of LOMBARDE towards validated arcs under more precise putative TRN predictions.
Venn Diagram
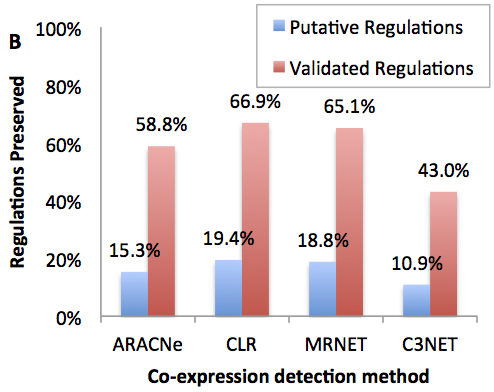
Robustness to co-expression criteria
LOMBARDE produces a topologically realistic TRN
- Average degree (number of interactions per operon) of the putative TRN was 10.7
- The value suggested in literature is in the range 1.5–2.0.
- Average degree of LOMBARDE output was 2.1.
- This is also close to the average degree in the network of validated regulations for E.coli, 2.0.
Degree distribution
- The degree distribution (proportion of operons for each degree) in LOMBARDE output is similar to the network of validated regulations, meaning that they share some structural properties.
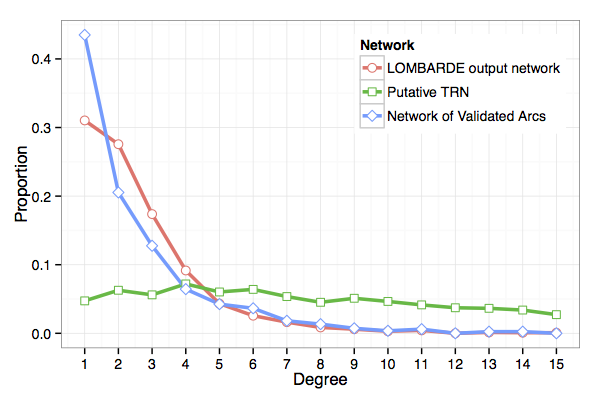
LOMBARDE produces a topologically realistic TRN
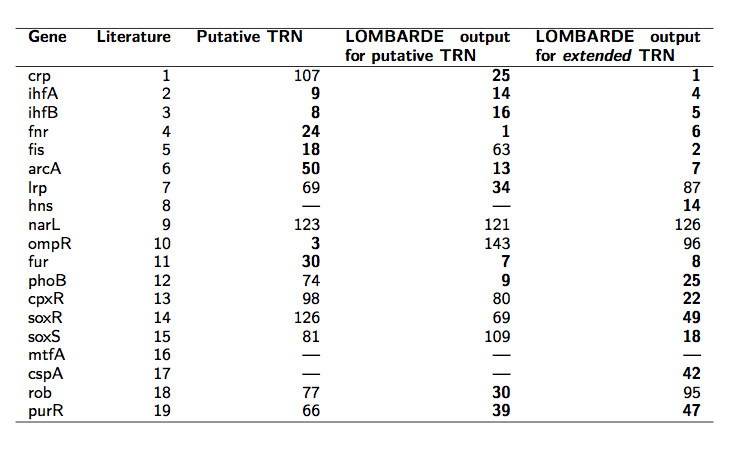
The network produced by LOMBARDE also contains most of the global regulators described for E.coli:
- Among 19 global regulators known for this organism, LOMBARDE output includes 16. Moreover, these 16 global regulators play a relevant role in LOMBARDE output.
Core of predicted E.coli regulators
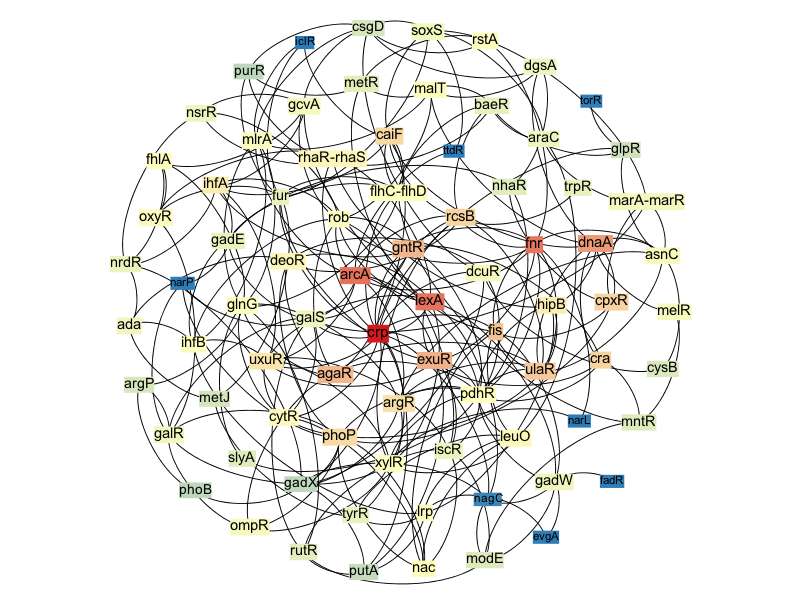
Global relevance of regulators can be evaluated using centrality indices
Using the radiality index, we could rank the regulators on LOMBARDE output. Among the most relevant regulators in this network we recovered 10 of the known global regulators.
- When LOMBARDE was applied to the extended input, the result recovers 18 of the known global regulators, 14 of them among the most relevant ones.
Ranking of predicted E.coli regulators
Results for A.ferrooxidans
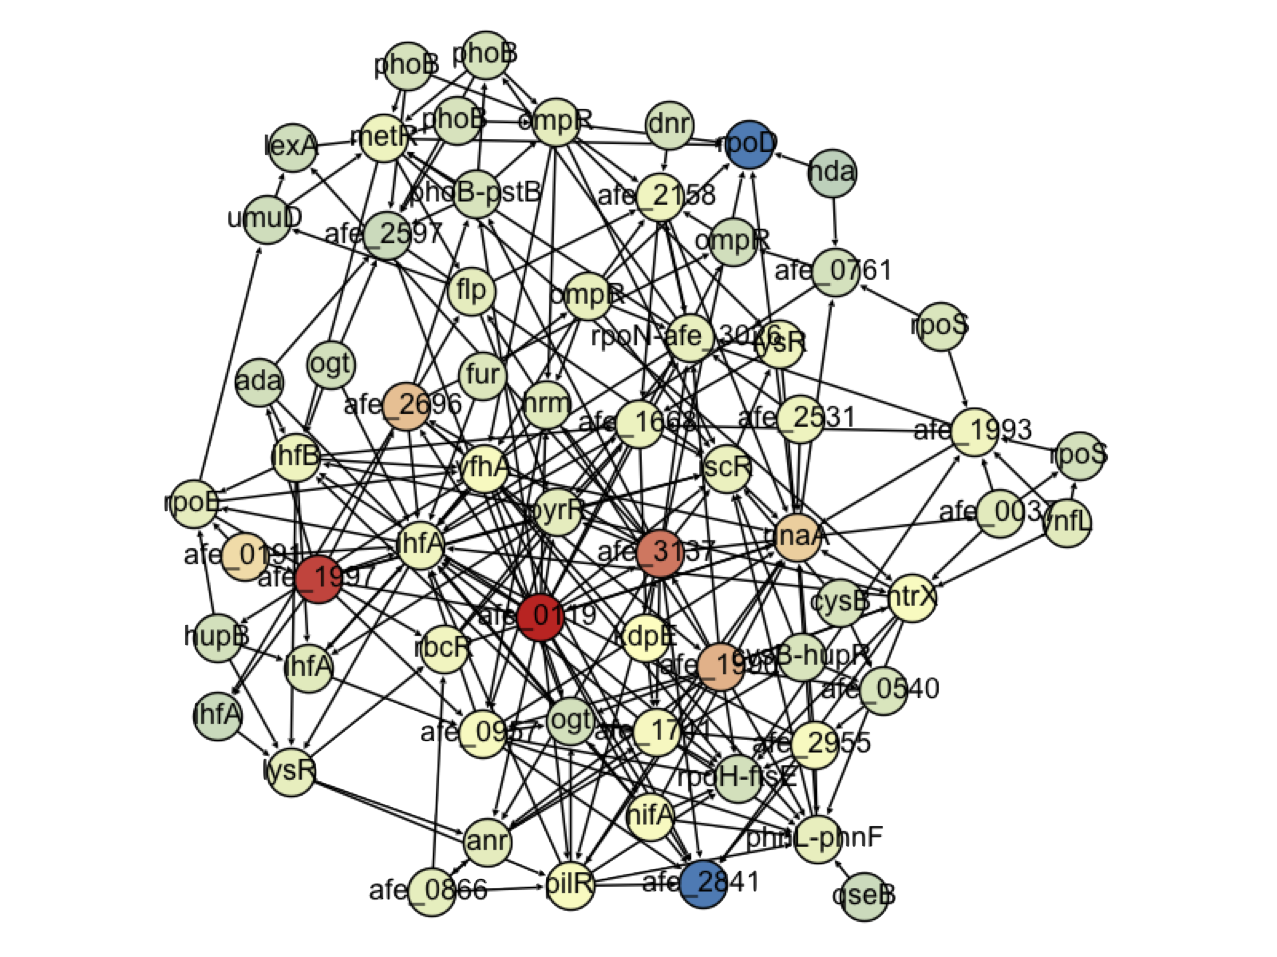
Results for A.ferrooxidans
- 64 regulators identified
- 19 of them have no known function
- Enrchment of Nitrogen related regulators
- Nitrogen fixation has been identified as a relevant factor in bioleaching (Levican et al, 2008)
Conclusion
LOMBARDE produces networks with realistic degree distributions, recovering and giving a central role to most of the global regulators described in literature.
In other words, LOMBARDE shapes the resulting network towards the structural characteristics of a true regulatory network.
Thanks!
Thanks!
Alejandro Maass (CRG, CMM)
Servet Martínez (CMM)
Mauricio González (CRG, INTA)
BioSigma
Anne Siegel (INRIA)
Miguel Allende (CRG)
MATHomics team