Final Exam
Computing in Molecular Biology and Genetics II
Prepared by Andrés Aravena, Ph.D. — Istanbul University
June 14, 2021
Please download the answer file, change the file name to your student number, and edit it on Rstudio. The filename should be something like 040567890.Rmd. Write also your student number in the correct place at the beginning of the answer file.
Question 0 should be answered immediately, right now. Stop reading now, and answer the question. Only continue reading after you delivered the photo of your handwritten document and signature. If you do not deliver this right now, your exam will not be graded, and you will get a 0.
If you have any issues or questions, write to me at my official email andres.aravena@istanbul.edu.tr (only for questions, not for answers). When you finish, send the renamed file (name like 040567890.Rmd) to andres.aravena+cmb@istanbul.edu.tr (only for answers, not for questions). You can also upload the renamed file to AKSİS.
0. Ethical Commitment
Copy the following text on a blank paper. Write it with your own calligraphy. Sign it, take a picture of it and send it immediately to andres.aravena+cmb@istanbul.edu.tr. Write your student number in the subject line of the email. Do not upload this to AKSİS.
CMB2 2021 Final Exam “Şerefim üzerine söz veririm ki, bu sınav sırasında etik kurallari çiǧnemedim”
Full Name:
Student Number:
Signature:
Date:
I understand that all answers are strictly personal, and unethical behavior will be penalized. I will work alone and deliver my personal answers. If I fail to do so, I understand that my grade will be 0.
1. Buying online
To prevent contagion during the pandemic, many people have stayed at home and avoided buying stuff in person. Instead of going out, they have used several e-commerce platforms. One of the benefits of online commerce is that small businesses located anywhere across Turkey can sell to clients in the big cities.
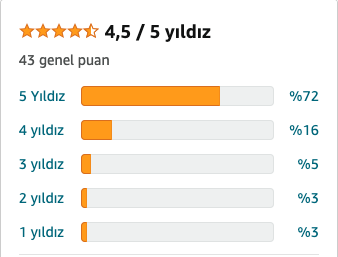
Another advantage of e-commerce is that you can see product reviews given by other people that bought the same product before. This evaluation is represented by the number of stars that each reviewer assigns. A bad product gets 1 star, a good one gets 5 stars. In the product’s webpage we can see the scoring profile, a bar plot with the percentage of people giving each score. For example, in the right side you can see the scoring profile of a book I recently checked:
We can represent that profile in R with a vector, as follows
book_profile <- c(3, 3, 5, 16, 72)
barplot(book_profile, horiz = TRUE, col="orange", xlim = c(0, 100), las=1,
        names.arg = paste(1:5,"stars"))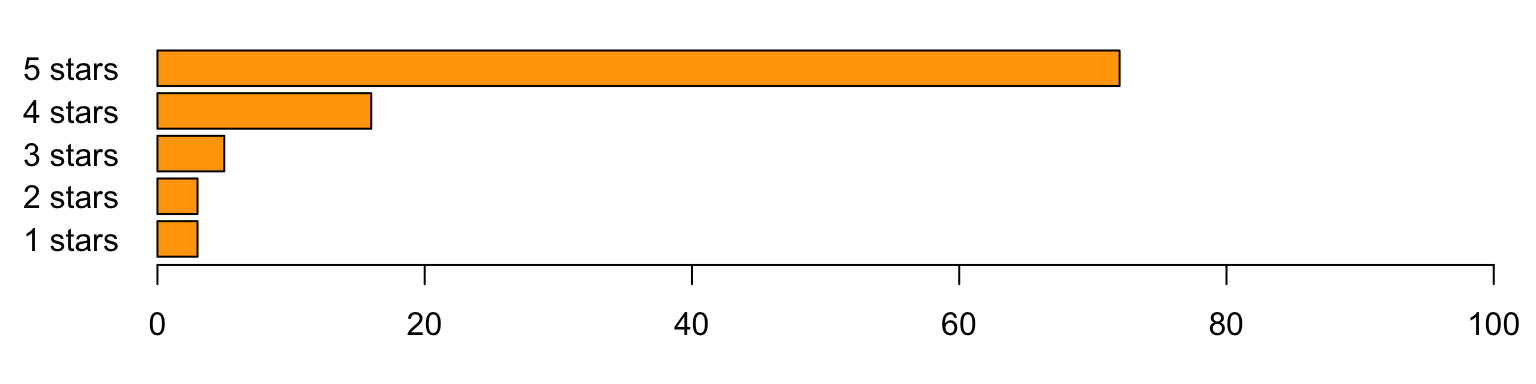
In simple terms, a profile is a vector of five elements, where each element corresponds to the percentage of people that gave the respective score. Element 1 is the number of people that gave 1 star, element 2 is the number of people that gave 1 star, and so on, up to 5 stars.
1.1 Average number of stars
Write a function to calculate the average number of stars. The function must be called average_stars and should receive a vector representing the profile. The function must return the average score, considering the profile. For example, if the profile is c(5,4,3,2,1), then the average is \[\frac{1+1+1+1+1+2+2+2+2+3+3+3+4+4+5}{5+4+3+2+1}.\] There is no simulation here, just basic statistics.
average_stars <- function(profile) {
  # write here
}
Now you can use this code to test your function
average_stars(book_profile)[1] 4.5252531.2 Standard deviation
Please write a function to calculate the standard deviation of the number of stars. The function must be called sdev_stars, should receive a vector representing the profile, and must return the standard deviation of the score. There is no simulation here, just basic statistics.
sdev_stars <- function(profile) {
  # write here
}
If everything is right, you should get exactly this value.
sdev_stars(book_profile)[1] 0.95129811.3 Standard error
The score we calculated just was based on 43 votes, so it is a small sample. The real score may be similar, but we cannot be 100% sure. We want to know what is our margin of error when we use the sample average to approximate the real average score. The margin of error depends on several things, including the standard error of the average.
Please write a function to calculate the standard error of the average number of stars. The function must be called stderr_stars, must receive a vector representing the profile and the sample size, and must return the standard error of the average score.
Hint: you can use the functions defined in the previous questions as part of this answer. This is not a simulation, just basic statistics.
stderr_stars <- function(profile) {
  # write here
}
If everything is right, you should get exactly this value.
stderr_stars(book_profile, n=43)[1] 0.14507161.4 Interval for the Average
Now we have all the pieces we need to calculate a confidence interval where the real average score is located. Please write the code to find a 95% confidence interval for the real average score, considering that this sample has 43 observations.
# write hereThe result of your code should be this:
[1] 4.232486 4.8180192. Simulation
Continuing our discussion of the scoring of products available online, now we will use the score profile as an empirical distribution for the whole population.
2.1 Simulate one sample
Assuming that the score profile represents the complete population, we can simulate one set of (let’s say) 100 reviews taken randomly from the population. Each review can give 1 to 5 stars, and the probability of each score corresponds to its proportion in the population.
Please write a function, called one_score, that takes the sample size s, and a vector p representing the score profile. The function must create a random sample of size s with the probabilities given by p, and must return the mean score of this simulated review.
one_score <- function(s, p) {
  # write here
}
You can test your function with this code. Your results may be different, but similar to these.
one_score(100, book_profile)[1] 4.532.2 Simulate one hundred thousand samples
Now we can replicate the simulation many times to build a vector representing all possible average scores when 100 randomly-chosen people give their reviews. Please write the code to replicate one hundred thousand simulations of the average of 100 reviews. Store the resulting one hundred thousand values in the vector many_scores.
# write hereIf everything goes right, you should see something like this
hist(many_scores, nclass = 30)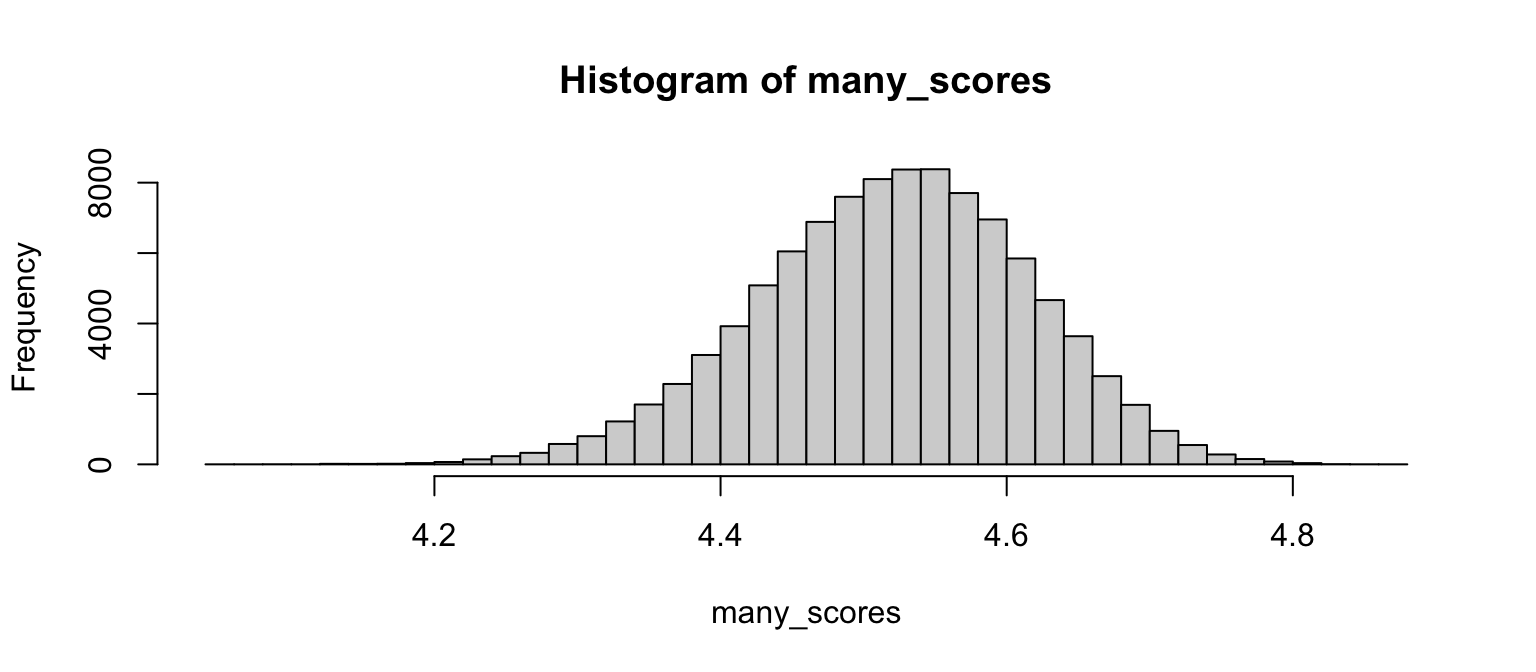
2.3 Mean and standard deviation
Write the code to find the mean and the standard deviation of the simulated scores.
[1] 4.525424[1] 0.09464807# write hereWrite your answer using only the pre-defined code chunk. Do not create any new chunk.
Now is a good moment to send me an email with your student number and the message “I have read the exam carefully”.
2.4 Confidence interval
Write the code to build a confidence interval containing 95% of the simulated scores.
Notice: This interval is different from the one in Question 1.4.
[1] 4.336128 4.714720# write here3. Comparing with another book
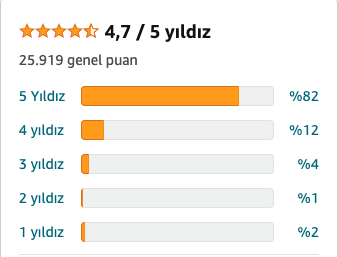
After looking at the previous book, I checked another book on the same topic that seems to have a better average score.
The scoring profile for the second book is the following vector
second_book <- c(2, 1, 4, 12, 82)
average_stars(second_book)
[1] 4.6930693.1 Simulate ten thousand reviews
As before, we can simulate the review process many times to build a vector representing all possible average scores for the second book when we average the score given by 100 randomly-chosen people. Please write the code to assign one hundred thousand simulated results to the vector second_scores.
Hint: you can use the functions defined in the previous questions as part of this answer.
# write here the code to create the vector `second_scores`If everything goes right, you should see something like this
hist(second_scores, nclass = 30)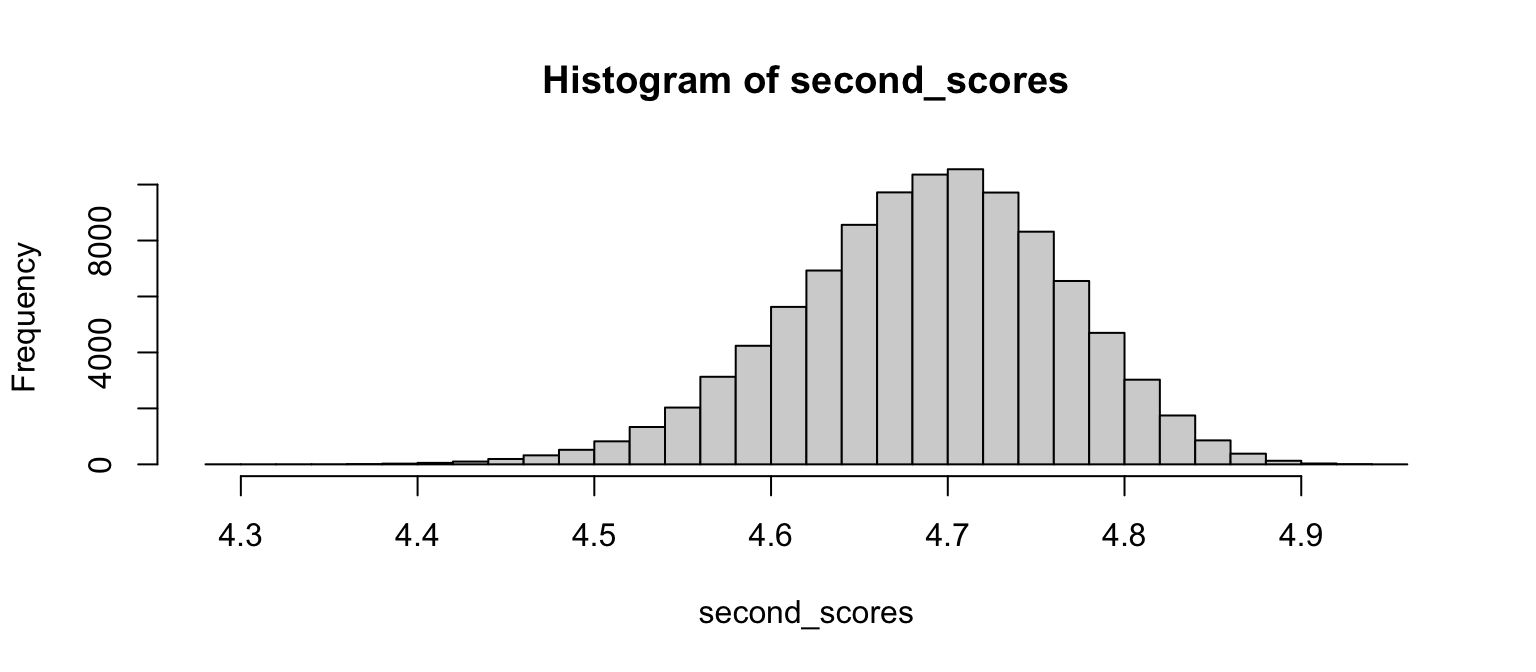
3.2 Is the second book really better than the first one?
From the average shown in the pictures, it seems as the second book is better than the first one. But maybe not. Now that we have simulated many of the possible outcomes of sampling the first and the second book, we can see if there are cases where the first book’s simulated score is larger than the second book’s simulated score.
Please write the code to find the proportion of cases when the first book seems better than the second one. The result should be a number between 0 and 1.
# write here[1] 0.075723.3 Effect of the sample size
In the previous question, we compared two simulations with 100 reviews on each. This is not the most realistic case since there are only 43 reviews for the first book and 25919 reviews for the second one. Please write the code to compare one thousand simulations of the first book’s average score for 43 reviewers, against one thousand simulations of the second book’s average score for 25919 reviewers.
Hint: you can use the functions defined in the previous questions as part of this answer.
# write here[1] 0.134. Why?
(One of these questions is a bonus. At least two of these questions must be answered. If you answer the three, you get extra points.)
These questions must be answered in plain English. They should not include any computer code. Write only in the designated area.
4.1 Why Normal?
Please explain (in plain English) why we can assume that the average values we calculated in Question 2 follow a Normal distribution.
# write here4.2 Why Questions 1 and 2 are different?
Please explain (in plain English) why the interval in Question 1 is different from the interval in Question 2.
# write here4.3 Exit survey.
Please fill the survey found following this link. You can also find the link on the course homepage.
All honest answers get a good score, especially if they provide constructive criticism. The idea is to improve our course, so no offense will be taken. On the other side, dishonest answers do not get any score.
Speak your mind.