Homework 5
Computing in Molecular Biology 1 – Molecular Biology and Genetics Department
Prepared by Andrés Aravena, Ph.D.
January 5, 2021
Please download the answer file and edit it on Rstudio. Write your student number in the correct place at the beginning of the answer file. You should be able to Knit HTML and get the same results as the document you have in paper. Please do Knit often and verify that your document has no errors. If your document does not Knit, you will not have full grade.
When you finish, send the answers.Rmd file to my mailbox (andres.aravena+cmb@istanbul.edu.tr). Be sure to use the correct email address and send only one file.
IMPORTANT: Write your student number in the correct place at the beginning of the answer file.
1. Student’s data
In this exercise we analyze the data stored at http://dry-lab.org/static/2020/cmb1/students2018-2020-tidy.tsv. Be sure to download and store it in your project folder.
1.1 Weight and height
Please draw this plot.
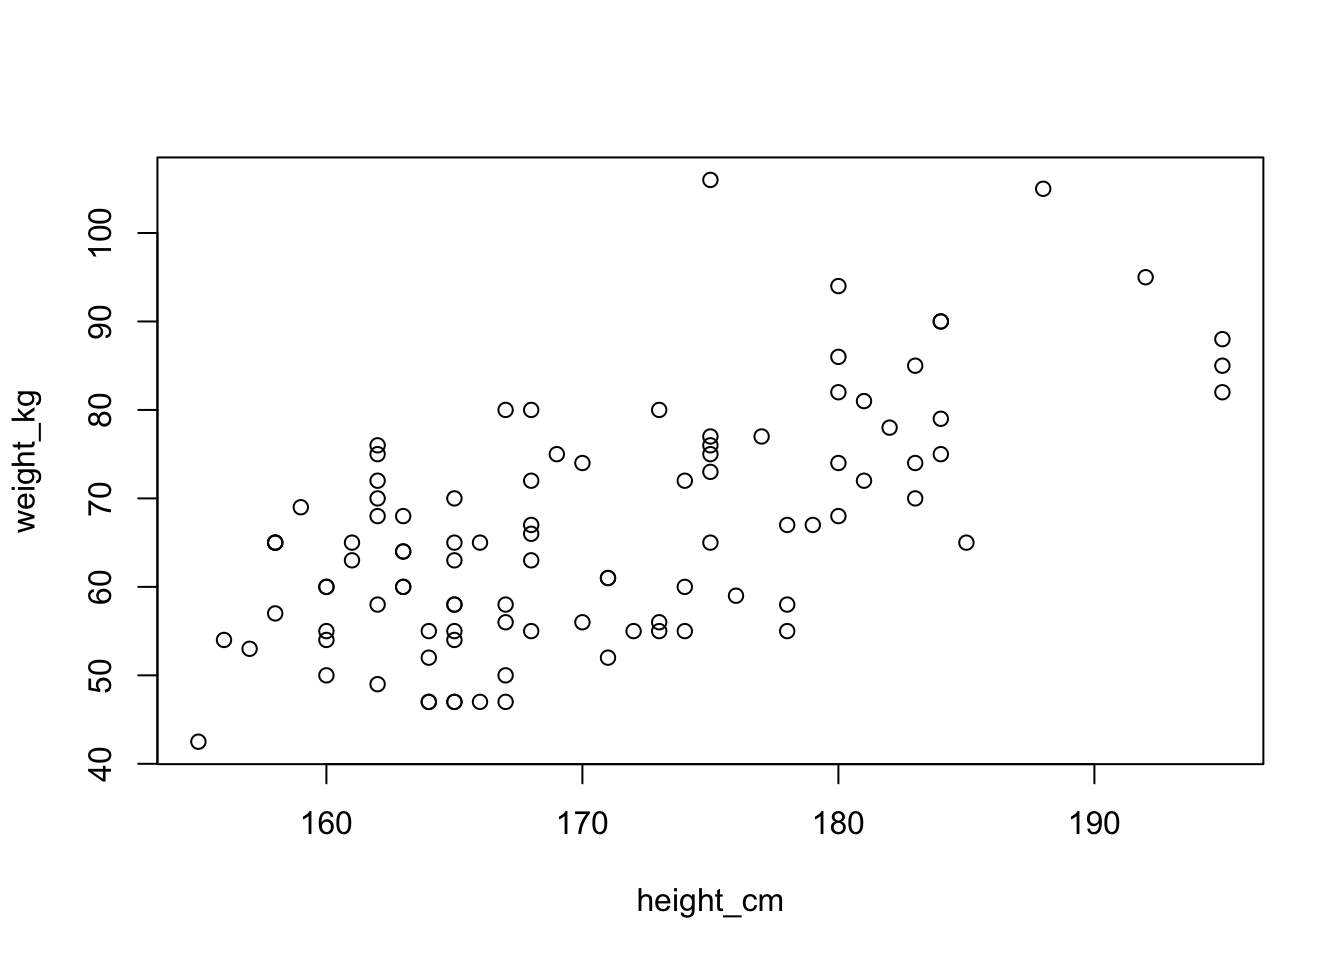
# replace all this line (including the `#` symbol) with your answer1.2 Weight and hand span
Please draw this plot.
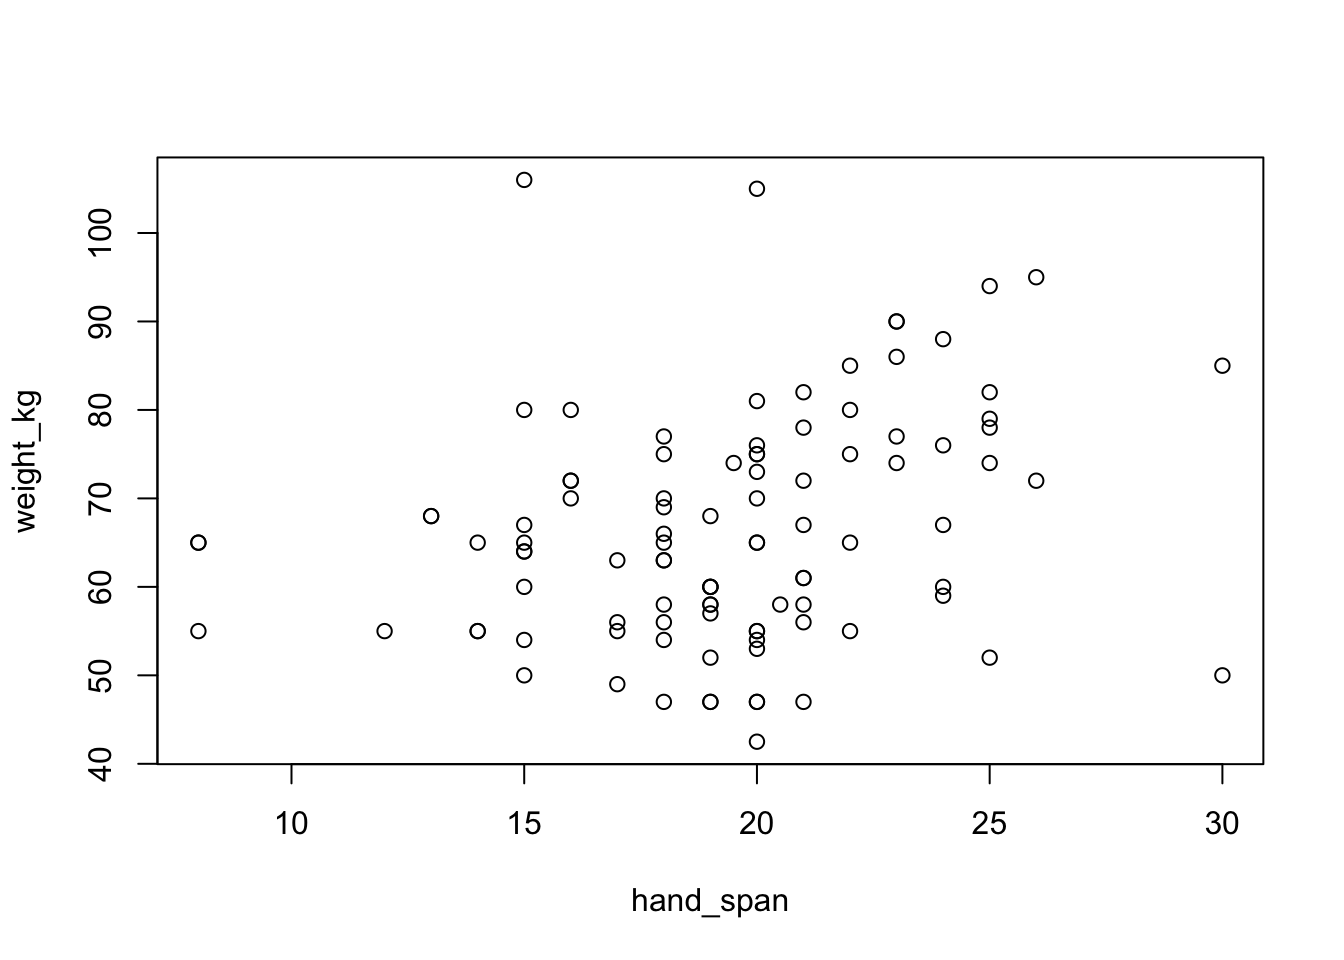
# replace all this line (including the `#` symbol) with your answer1.3 Linear model
Please build a linear model describing weight as a function of hand span. Show the coefficient of this model.
(Intercept)   hand_span
 49.7869415   0.8638416
# replace all this line (including the `#` symbol) with your answer1.4 Are men taller than women?
Please draw this plot showing height depending on the individual’s sex. It is useful to make sure that the sex column is a factor.
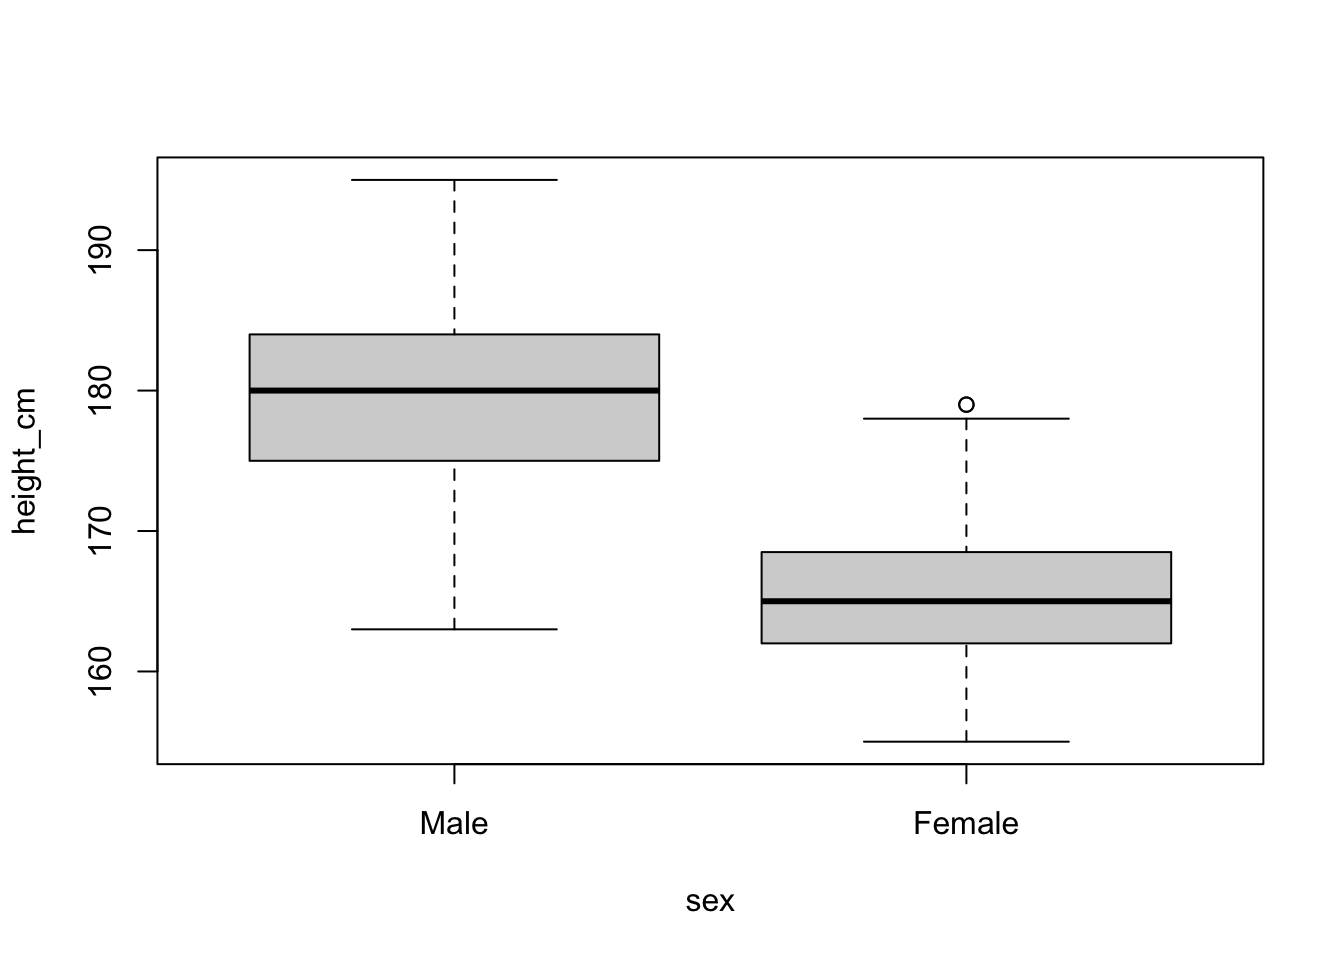
# replace all this line (including the `#` symbol) with your answer2. USA COVID-19
Please download the data about COVID. You can use the official data from WHO or the copy in the course’s webpage.
2.1 USA new cases
Please draw this plot.
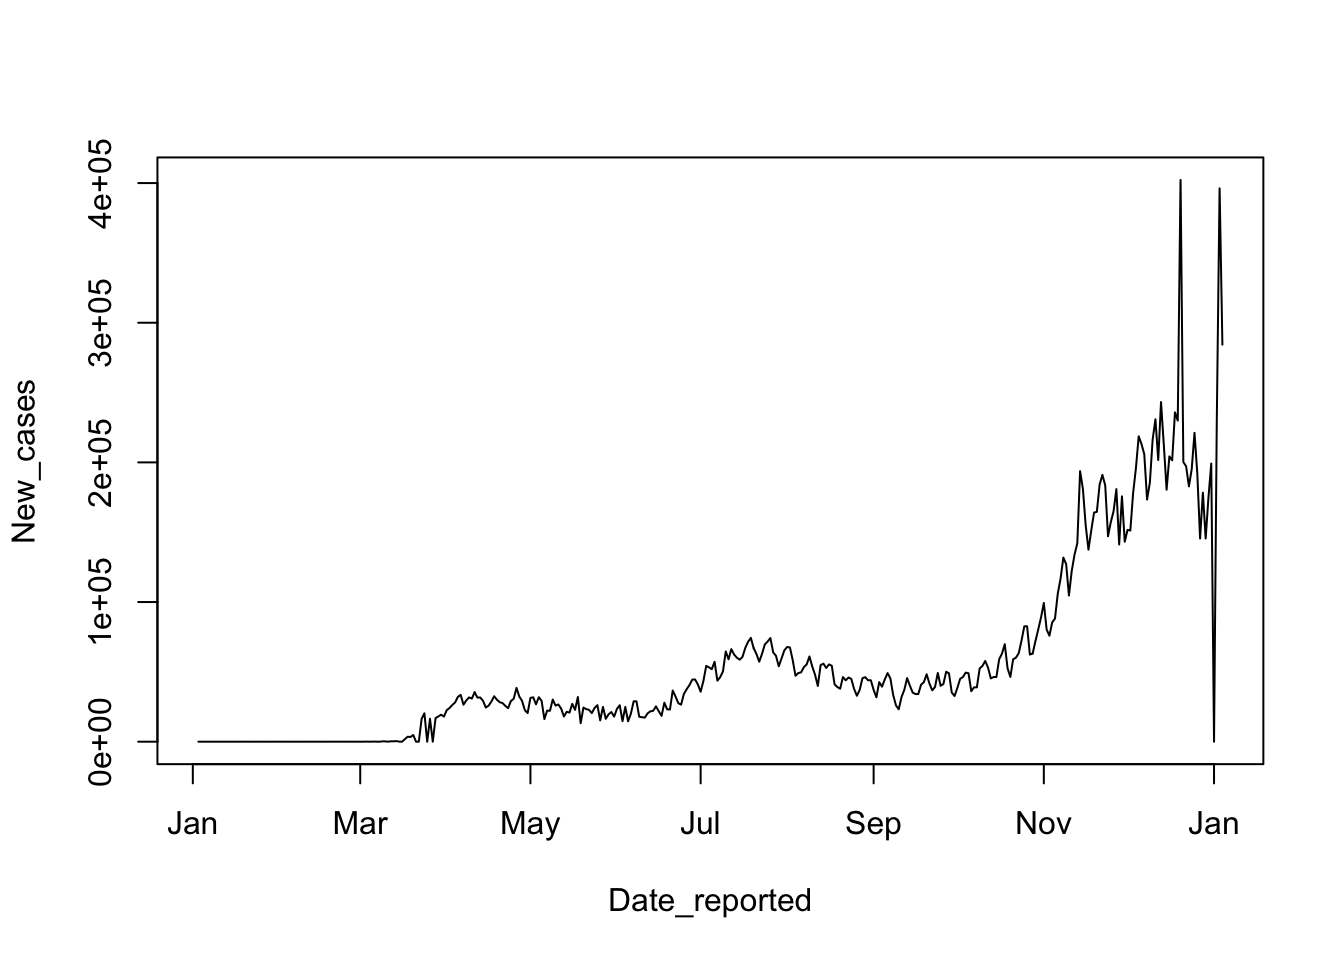
# replace all this line (including the `#` symbol) with your answer2.2 New cases in USA between September and December
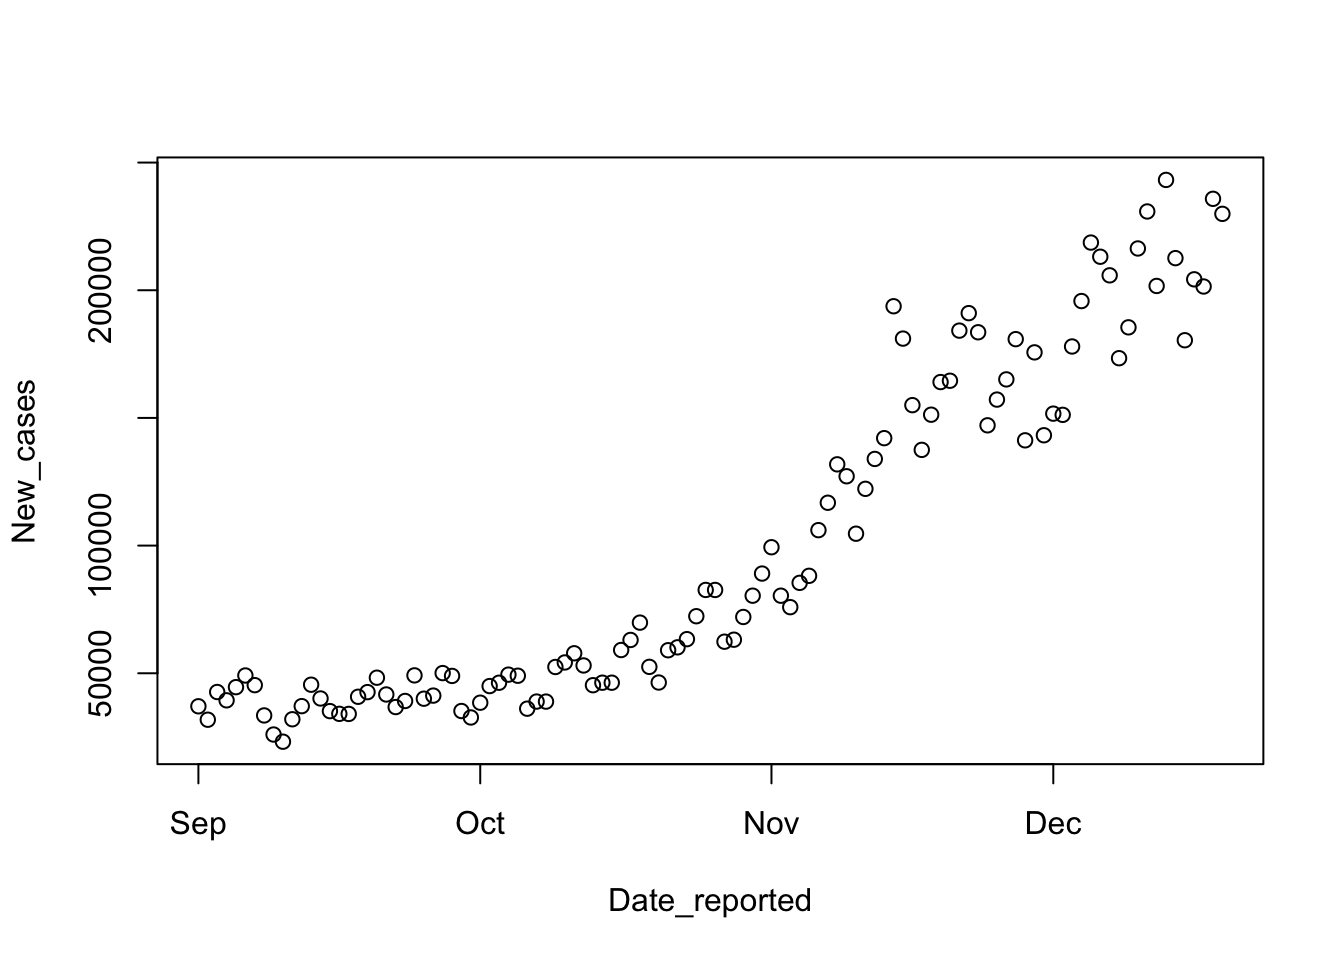
Please create a new data frame, called Sep_to_Dec_USA, containing the observations for US between September 1st and December 19th (inclusive). Then draw this plot.
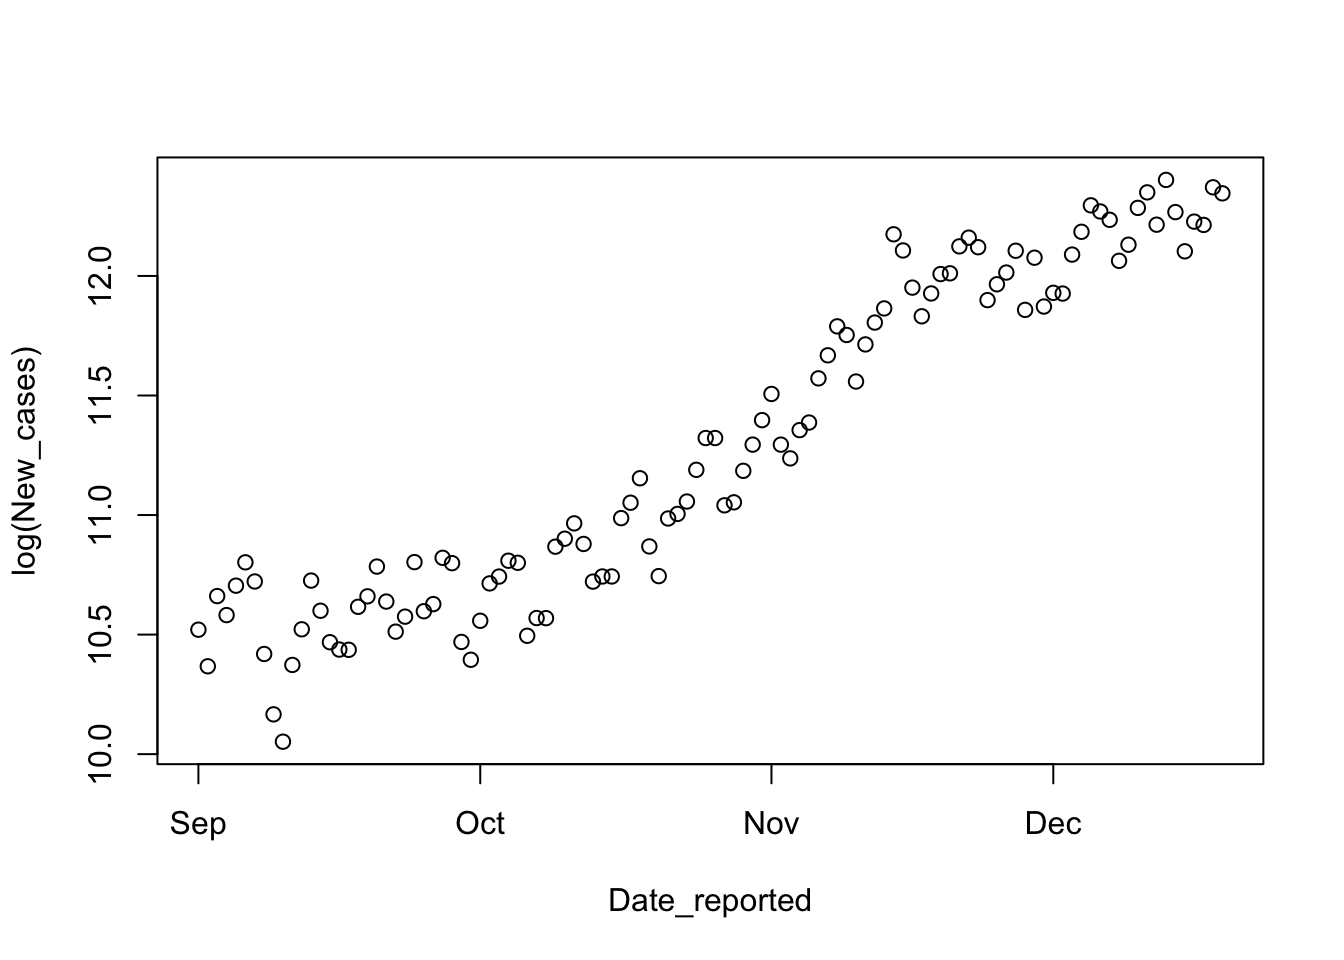
# replace all this line (including the `#` symbol) with your answer2.3 Semilog plot
Please draw this plot using the data in Sep_to_Dec_USA.
# replace all this line (including the `#` symbol) with your answer2.4 Average growth rate between September and December
Using again the data in Sep_to_Dec_USA, please build a linear model and calculate the growth rate of New cases in the relevant period. Please write the growth rate as the daily percentage of increase.
Date_reported
     2.036928
# replace all this line (including the `#` symbol) with your answer