Testing Homework 5
Prepared by Andrés Aravena, Ph.D.
23 March 2020
1 Calculate the GC content for only part of the genome
Write a function called window_gc_content(), that takes sequence, position, and size as input, and returns a single value with the window GC content. You can test this function with the genome of E.coli.
Verify that your function has the correct name and inputs.
library(seqinr)
sequences <- read.fasta("NC_000913.fna")
The output of read.fasta() is a list. We want only the first element. Let us test several times. Your results should be these
window_gc_content(sequences[[1]], 250000, 100)[1] 0.48window_gc_content(sequences[[1]], 250000, 400)[1] 0.5275window_gc_content(sequences[[1]], 1250, 100)[1] 0.56window_gc_content(sequences[[1]], 1, length(sequences[[1]]))[1] 0.50790712 Using window_gc_content() in many places
We want to evaluate window_gc_content on different positions of the genome. Specifically, we want to evaluate in these positions:
positions <- seq(from=1, to=length(genome)-window_size, by= window_size)Obviously, the result depends on the genome and window_size. Please write a function that takes as inputs genome and window_size, and returns a vector with the GC content of each of the windows in each of the positions.
Here the function name is not specified. You can choose any name. I choose
many_window_gc_content(genome, window_size).
When the output is too big, we better plot it.
many_window_gc_content(sequences[[1]], 1e6)[1] 0.514422 0.496824 0.506171 0.511587many_window_gc_content(sequences[[1]], 1e5) [1] 0.52585 0.51487 0.52047 0.51199 0.51753 0.49979 0.51432 0.51256 0.51537
[10] 0.51147 0.50731 0.50422 0.48734 0.50430 0.49171 0.48510 0.48541 0.50527
[19] 0.49479 0.50279 0.49344 0.49727 0.51585 0.51490 0.48942 0.52289 0.52455
[28] 0.49081 0.52198 0.49060 0.51467 0.50985 0.51090 0.51374 0.50547 0.52461
[37] 0.50904 0.50322 0.50557 0.51880 0.51290 0.52335 0.51170 0.51616 0.50728
[46] 0.49562plot(many_window_gc_content(sequences[[1]], 1e4), type="l")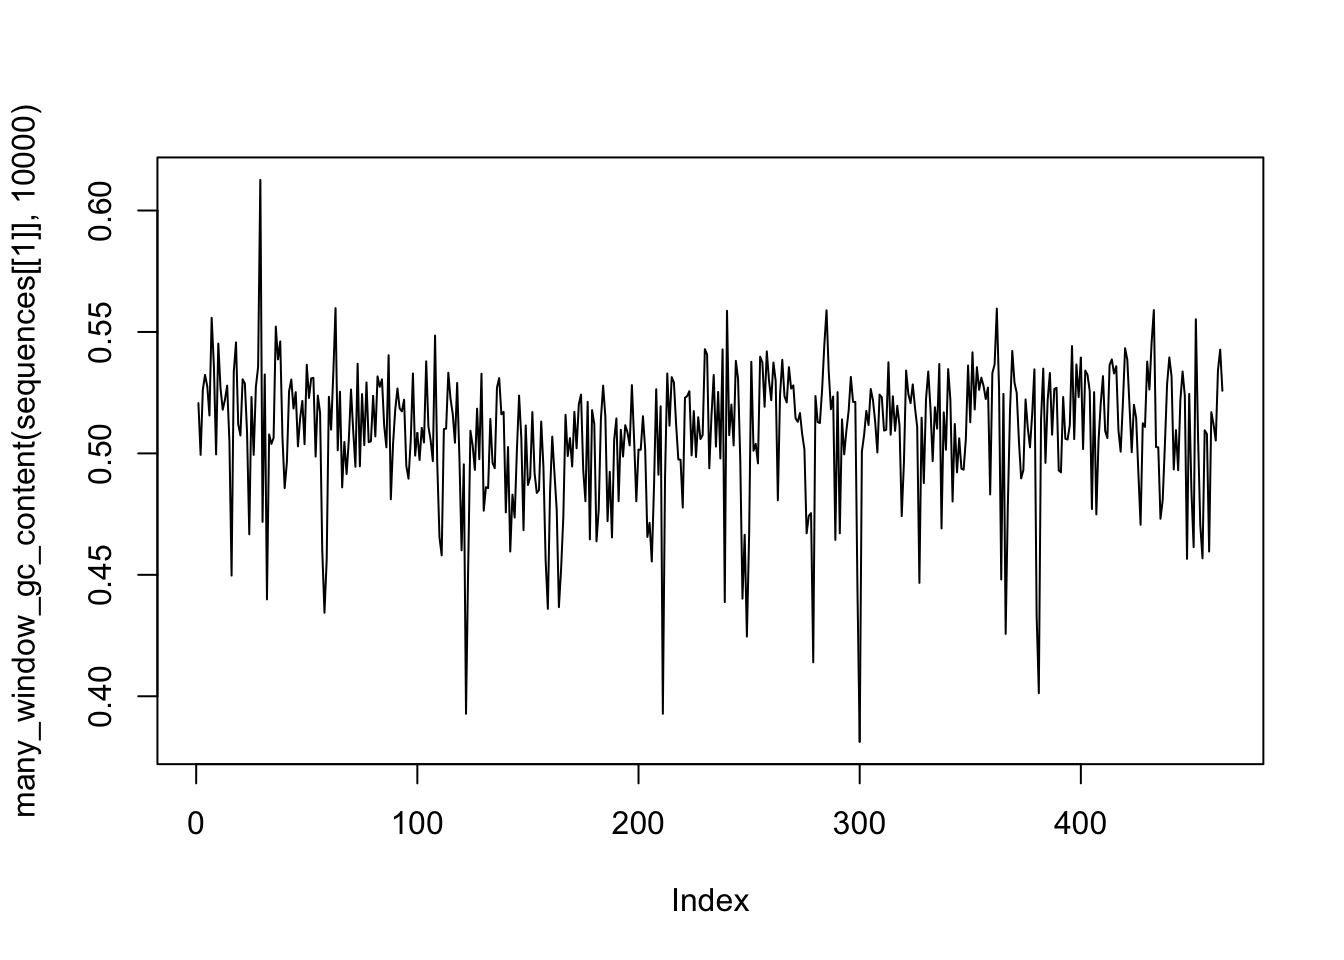
3 GC Skew
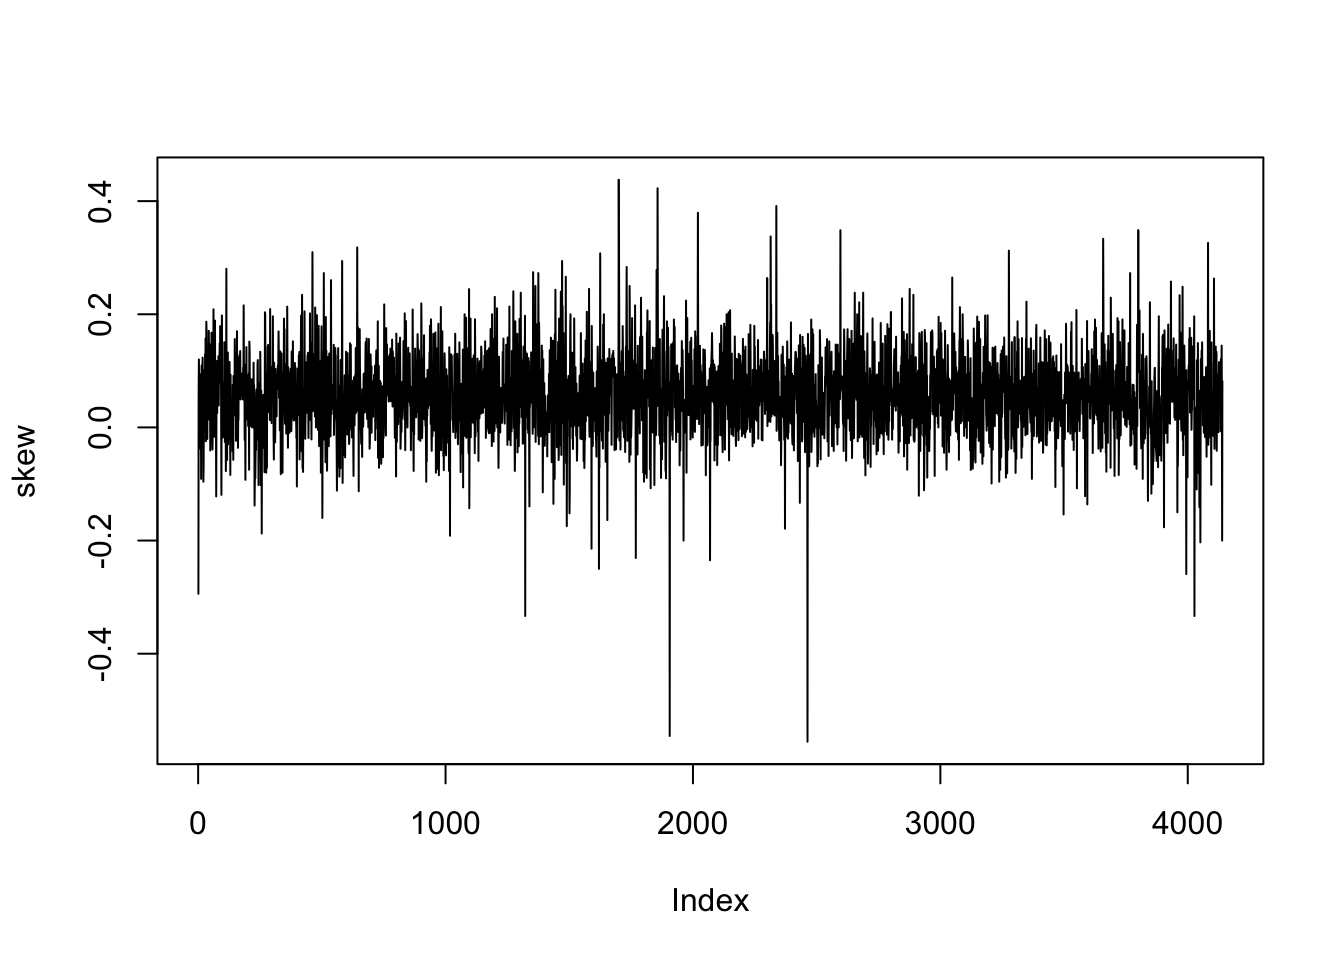
Write a function that takes a list of genes, and calculate the ratio (nG-nC)/(nG+nC) for each gene. The function should be called gene_gc_skew and takes only one input: a list called genes. What should be the output?
Load only genes, not genome. The output is big, so we look at the first 10 elements, and we draw a plot.
genes <- read.fasta("NC_000913.ffn")
skew <- gene_gc_skew(genes)
length(skew)
[1] 4140skew[1:10] [1] -0.29411765 0.05891354 0.12000000 0.07058824 -0.03750000 0.02072539
[7] 0.03276540 0.02822581 0.09375000 0.02325581plot(skew, type="l")