In October 2005, at the Laboratory of Bioinformatics and Mathematics of Genome in Chile, we prepared this workshop to introduce some ideas of bioinformatics to the general public. It is simple and allows us to get acquainted with the core ideas that we will explore in this course.
Please, tell me if you find any mistake or error. In particular, there is some confusion between clones and fragments, and the databases have changed a lot in the meantime.
1 Introduction
The objective of this experience is to learn some of the techniques used in the bioinformatic analysis of a microorganism.
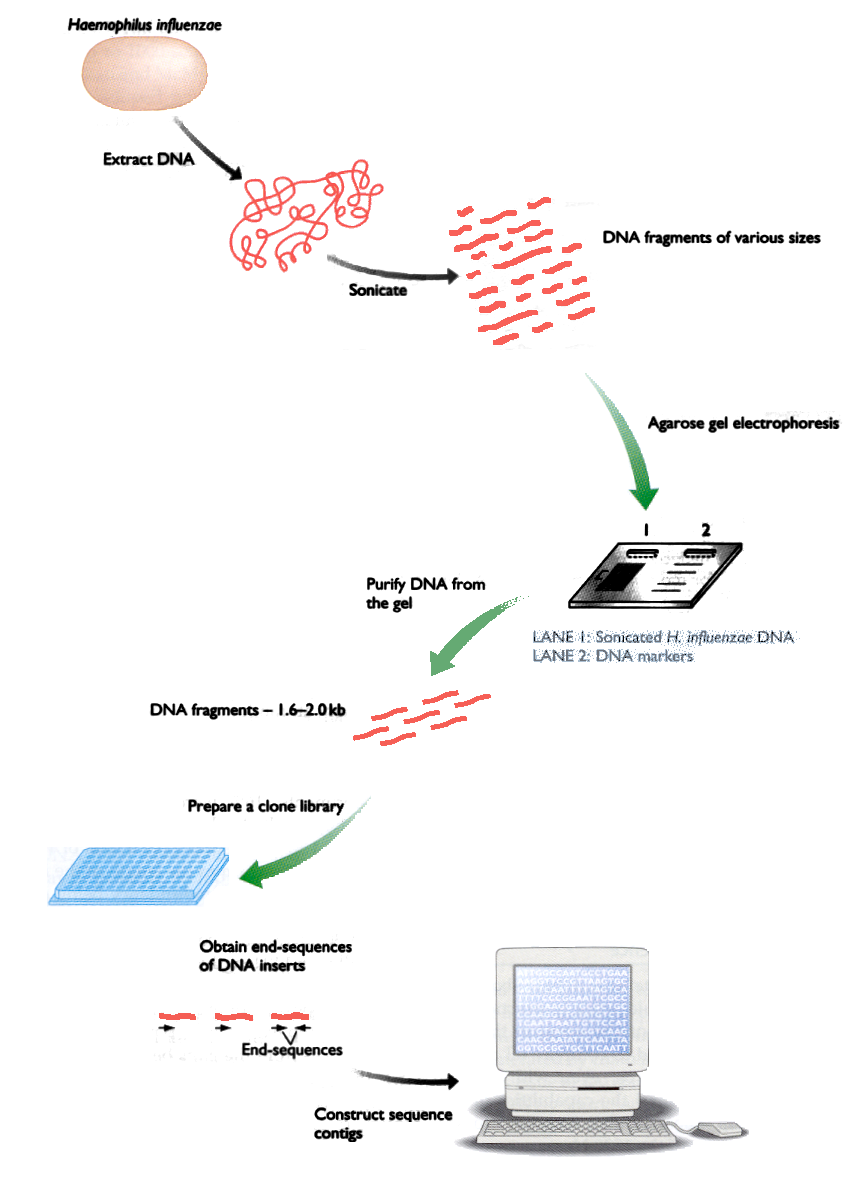
Fig. 1: Stages of the sequencing method by shotgun
A DNA molecule is composed of two strands, each of which is a chain of nucleotides. To sequence means to determine which are the nucleotides in the DNA. There are four types of nucleotides, which are represented by the letters A, C, T, and G. The two strands are complementary, that is, if there is an A in a strand, it always has a T in front, and in front of a C there is always a G. For this reason, it is enough to know the sequence of letters of a thread to know immediately the sequence of the other.
gatcacctcctttaaagaaaagggtctagaccccacacacgccactcggtaaggaattgg
ctagtggaggaaatttcttttcccagatctggggtgtgtgcggtgagccattccttaacc
The most common way to get the DNA sequence of an organism is to generate it from small fragments that overlap each other. This method does not require any previous knowledge of the genome and is called “Shotgun”. Figure 1 shows the different stages of this method.
The first step is to break the genomic DNA into fragments, using high-frequency sound waves that produce cuts random in the DNA molecule. The fragments are then separated by using electrophoresis into pieces of 1000-2000 letters.
For each fragment (or piece of the genome), the sequencer reads both ends and delivers an image (chromatogram) that is processed to obtain the sequences of letters. Once you have all the sequences, one program joins the pieces and tries to reconstruct the sequence genomics.
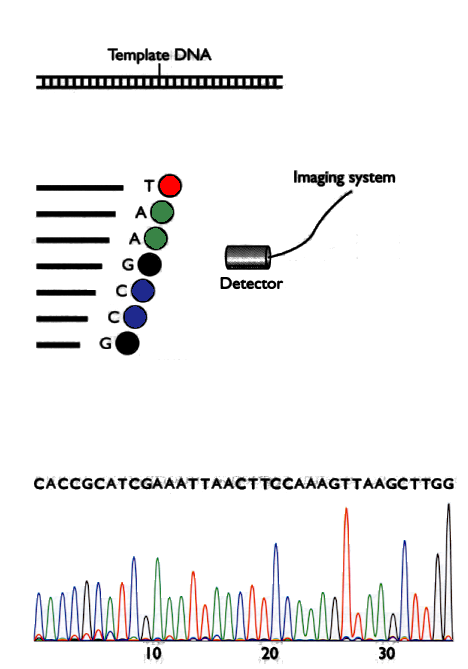
Fig 2: Generation of chromatograms
Bacteria generally have a single chromosome or DNA molecule, although some bacteria may have more than one. Moreover, most bacteria have smaller DNA molecules called plasmids. In general, the final result of the sequencing should be a single sequence of letters representing the entire genome of the organism.
Due to the technology used, you normally do not get a single sequence but several fragments, so that more specific sequencing and a more detailed analysis of the data to decipher the entire genome of an organism.
A bacterium usually has a genome of 1.5 to 4 million letters. Automatic sequencers can correctly read 600 letters on average. In order to have an abundant overlap of fragments to assemble, genomic projects build approximately 25,000 fragments, that is, 50,000 sequences that must be assembled to build a single final sequence.
To perform the automatic sequencing, the piece of DNA that is we want to sequence and generate fragments with lengths ranging from 1 to length of the piece of DNA, where all the fragments have the last nucleotide labeled with a fluorophore having a different color for each letter. Then a detector generates an image called a chromatogram and programs, which are described below, determine the sequence of letters of the piece of DNA. The method is described in Figure 2.
2 Activities
2.1 Receiving and displaying chromatograms
- Objective
- To know the data generated by a sequencer.
- Keywords
- Fragments, Chromatograms.
- Technical elements
- CodonCode Aligner software.
- Description of the activity
- Getting acquainted with the program CodonCode Aligner.
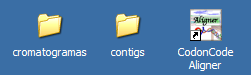
- Download and install CodonCode Aligner from https://www.codoncode.com/aligner/download.htm. Download and unzip the data from https://anaraven.bitbucket.io/static/bioinfo/workshop-data.zip.
Open the CodonCode Aligner software by double-clicking on your icon on the desktop.
A dialog box will appear that indicates which type of session you want use, choose Demo. The following will appear:
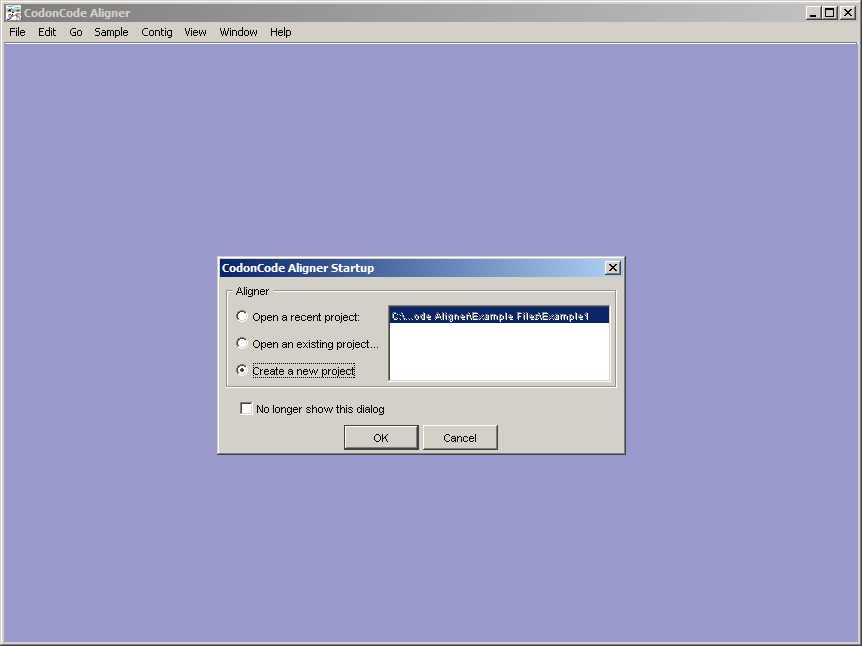
Select the item, press OK.
In the File menu go to the
Importsubmenu and chooseAdd Folder. In short,File→Import→Add Folder.In the dialog box, choose Desktop, where you will see the folder chromatograms. Click on the chromatograms folder and press the Open button. A window will be displayed with the new project.
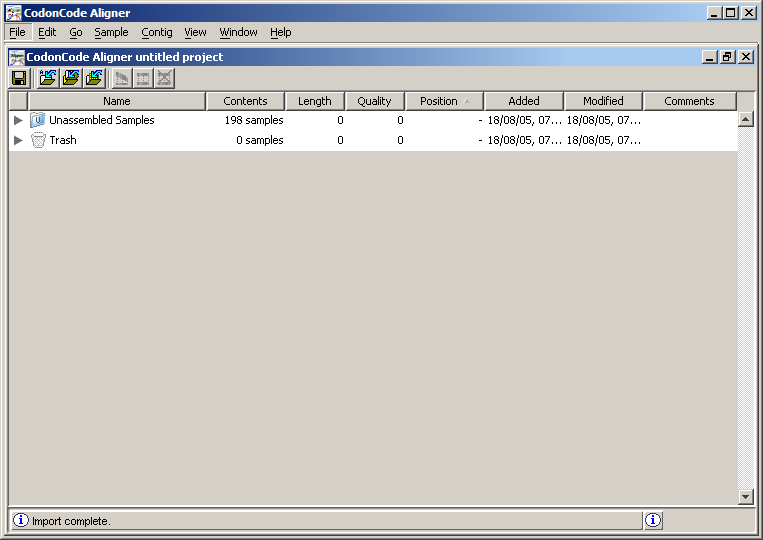
In this window, the Unassembled Samples folder contains the chromatograms of the fragments, which are the files resulting from the sequencing of a genome. Click on the gray triangle located immediately to the left of the name of this folder. Will see then all the chromatogram files listed.
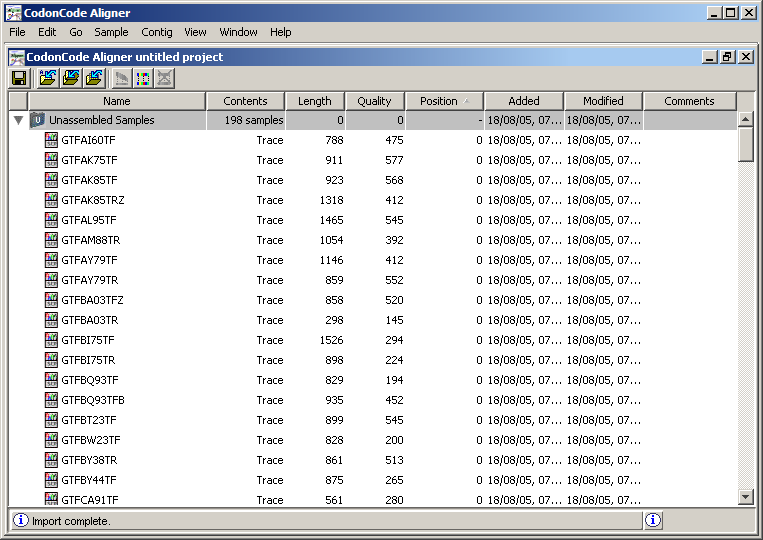
Double click on the chromatogram
GTFAI60TF. You will observe the signals for the four nitrogenous bases in different colors, which are four curves whose maxima mark the position of the letter respectively. This set of signals is the Chromatogram of the fragment. At the top of the window, you can see the interpretation of these signs as letters. In some cases, it is difficult to unambiguously distinguish which curve reaches the maximum, as shown in the graph. Consequently, each letter associated with a quality value, which represents the level of certainty with which the symbol is known. This quality is reflected in the background color of the letters on the upper horizontal axis of the graphic. Intuitively, discover the relationship between the quality and intensity of green looking graph.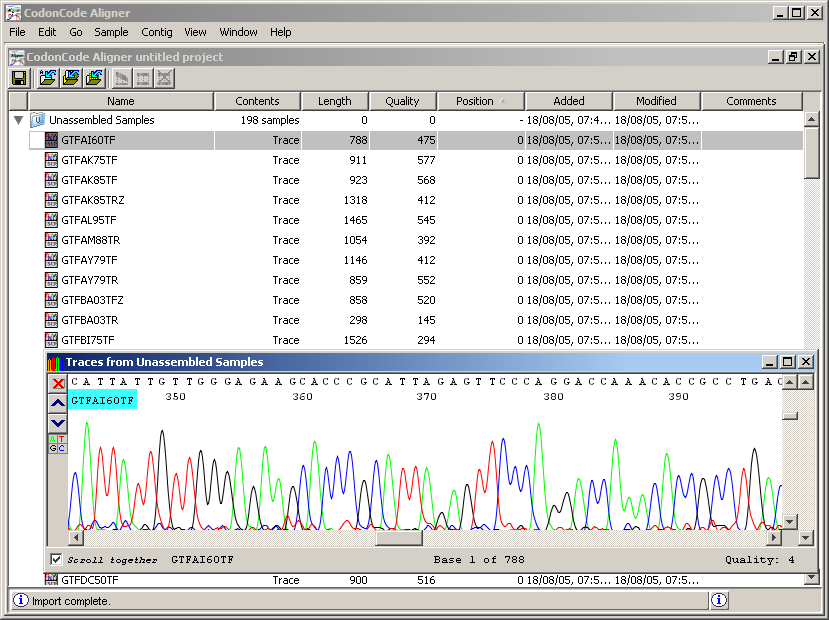
It may be noted that the quality of the signal changes throughout the chromatogram. Scroll using the bottom bar throughout the chromatogram and notice how the amplitude of the signals increases or decreases.
In general, a raw chromatogram may have about 1000 to 1500 letters, but the useful region is usually 300-700 long. The error of the letter assignment in the chromatogram is most of the times at the ends, the central part being generally of the chromatogram part of good quality.
Close the window showing the chromatogram
GTFAI60TF.
2.2 Assignment of letters: Base calling and quality control
- Objective
- Transform the chromatograms into letter sequences. Evaluate the quality of this sequence.
- Keywords
- Quality, base calling.
- Technical elements
- CodonCode Aligner software.
- Description of activity
- All chromatograms obtained in the previous stage must be transformed into letters. We can do that with
CodonCode Aligner.
When looking at the screen that shows the fragments we see that there are several columns that provide information about the same. Now we will concentrate on the base-call. When we talk about the quality of a nucleotide, we speak of a number associated with the letter that indicates how reliable is that letter. The process of assigning each letter in the chromatogram, and assigning a quality is the denominated base calling. Choose the fragment
GTFAI60TF, mark it with a click, and from the View menu select Qualities. You should see something like the following: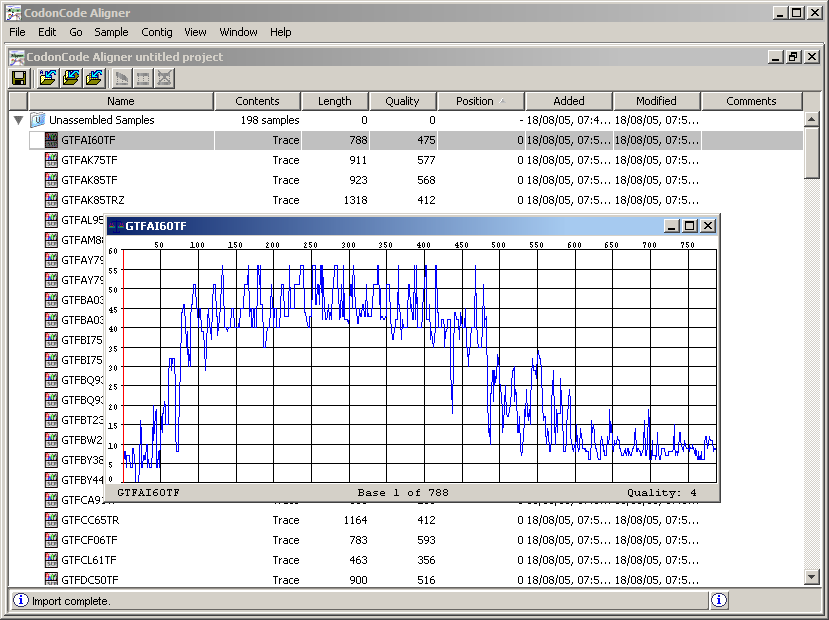
Traverse the graph in its entirety by moving the red line with a click the mouse where you want to move. Comment on the relationship between the green tones in the letters when you read the chromatogram and the variations in the amplitude of the graph.
Close the Quality window.
2.3 Assembly and visualization of contigs
- Objective
- Combine the chromatograms in order to obtain longer sequences called contig.
- Keywords
- Contig, consensus, alignment.
- Technical elements
- CodonCode Aligner` software.
- Description of the activity
- Now you have to “solve the puzzle”.
Before “assembling the puzzle”, the sequences of the fragments should be pre-processed to remove from them both the edges of poor quality as the experimental vestiges of its obtaining. The latter are the remnants of the so-called cloning vector used.
To remove the remnants from the folder, click the folder and then go to the menu where you should select the option.
To remove the poor quality edges of the fragments, go to the menu Sample and select the option.
Already assigned the qualities to the readings and pre-processed the sequences, we are able to assemble them to form longer sequences. With the project open in the Software CodonCode Aligner, click the folder. Then in the Contig menu choose the option. The program will ask if you want to continue even when you can not record, select Continue. Then, you should see something like the following:
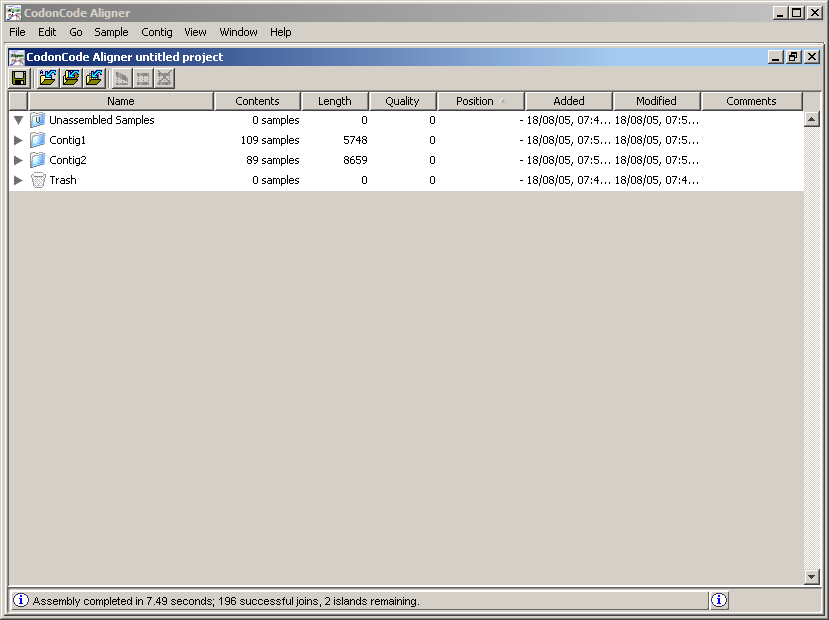
Note that the readings are now in new folders called Contig1 and Contig2 (see the Contents column for each folder). A Contig is a set of readings that were assembled by having some degree of similarity between their letters. To see the readings of each contig, click on the triangle to the left of the folder name. Double click on the Contig2 to display the following:
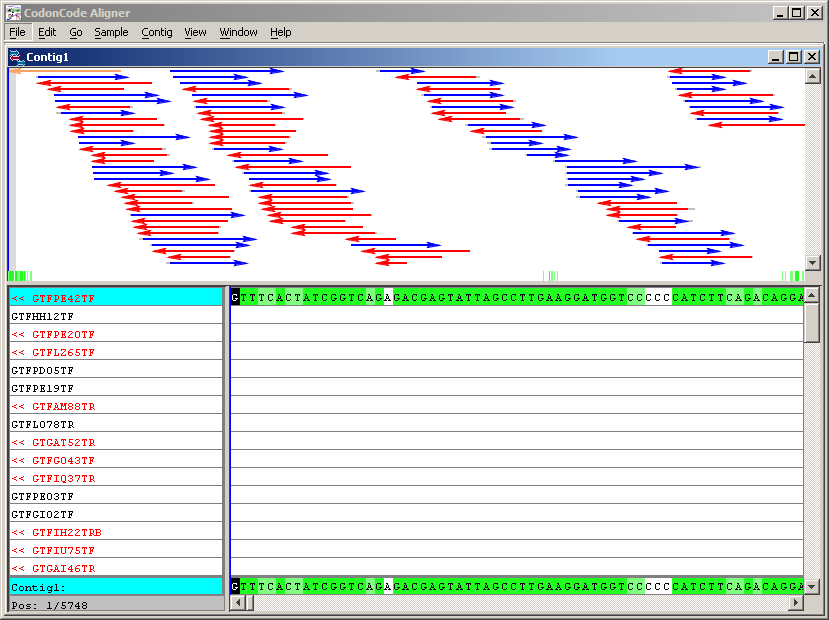
The window has two fields: the upper one where a scheme is shown of the assembly of the Contig2 readings and the lower shows the detail of the sequences assembled. In the countryside click on different points and look at the detail of the assembly The diagram also indicates the strand in which they were assembled the readings. Let’s see how the sequence of the Contig2, also called the consensus sequence Contig2, corresponding to the last sequence that can be seen in the window. Click on any letter in the sequence consensus. In the Go menu, choose Base Number and enter position 3319.
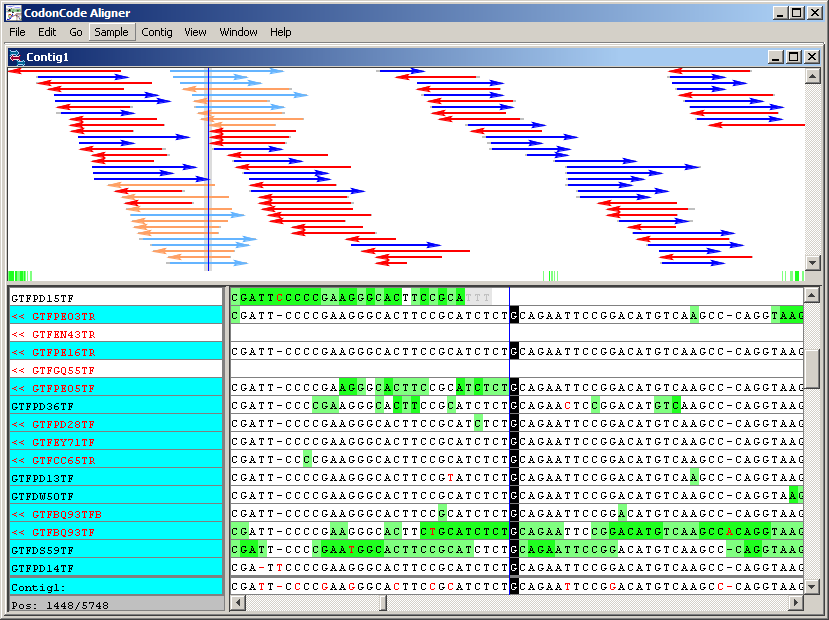
In this position, there is a discrepancy between the readings. When this happens, the consensus sequence chooses the letter associated with the readings of better quality. The last line shows that in this if the consensus is left with the letter T. To compare the chromatograms of the readings involved, select from the menu View the Traces option and maximize the resulting window.
2.4 Genome annotation: Identification of the microorganism
- Objective
- Determine from the sequence of the 16S gene the taxonomic identity of the organism studied.
- Keywords
- Genes, proteins, 16S, alignment.
- Technical elements
- BLAST program, GenBank database.
- Description of the activity
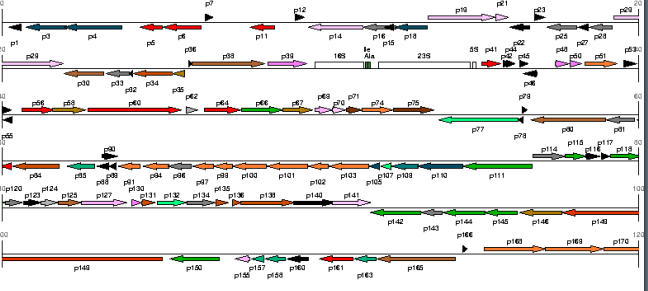
In the previous stage sequences of letters were constructed that corresponds to the DNA of a biomining bacterium. The objective of this and the next activity is to mark, within these sequences of letters, the information that corresponds to the different signals that they contain. Many of these signals simply correspond to subsequences or words. Among the signals, those that are transcribed in proteins (a through the genetic code) or other molecules constitute the group and are called genes. The work of genome annotation is to identify and characterize regions of DNA which are signs. The following figure shows a series of genes annotated in a piece of the DNA of an organism.
A common strategy to identify an organism is to find the gene called 16S. The classic method is to compare the contigs that we have generated with known 16S genes, under the principle that they are highly conserved. It is known that, in general, the genes of different species are similar (but not identical). In the historical evolution of the species, the genome accumulates changes in which some letters mutate, insert or disappear.
These comparisons are performed using the algorithm called BLAST in their different variants. We proceed to identify our organism.
Open your Internet browser and point to http://www.ncbi.nih.gov/BLAST/. This page allows you to compare genomic sequences against the databases.
In the
Nucleotidemenu selectNucleotide-nucleotide BLAST (blastn)as search type. This BLAST mode allows comparing a DNA sequence against a base of DNA sequence data.Select the database nr. This database contains all the DNA sequences that have been published to date.
It will then proceed to look for the sequences most similar to the contig 1 among all published sequences. In the folder, contigs open the
contig1.txtfile. Select all the sequence (you can use Control+A) and copy it (Control+C). Then paste it into the text area of the BLAST page (you can use Control+V).Press BLAST!. A window will appear with your request. Press Format!. The search may take some minutes.
The search result is divided into 3 parts. In the beginning, a chart that outlines the contig and the regions with the that it has similarity, as seen in the figure a continuation. When you hover the mouse pointer over these lines, displays a brief description.
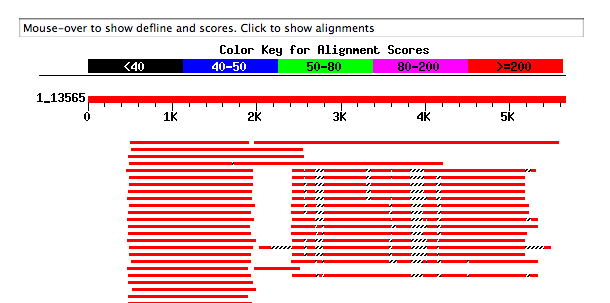
It is noted that there is an important contig zone that looks like many known sequences.
The second part of the BLAST output contains a list with the summary of the database sequences that resulted similar to our contig, ordered from more similar to more different. Each line has a sequence identifier, a description, a score and a “distance”.
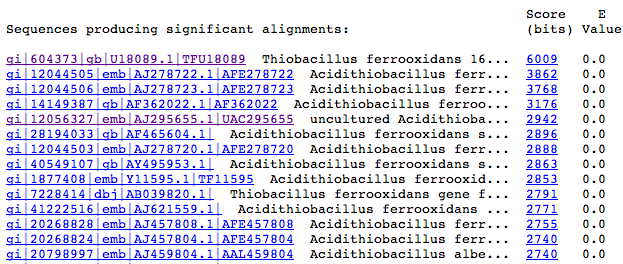
The blue reference in the first column allows you to view the bibliographic references of each sequence. The second column identifies the sequence. The third column shows the alignment, where higher values indicate greater similarity. Doing click on this link you see the detail of the alignment. The last column shows a “distance” index between the sequences. Values less than 10-10 are significant.
Examining the first lines of this list we can form an idea of what kind of organism the bacterium is sequenced. The contig 1 is very similar to the 16S gene of several bacteria. Then the detail of the alignment is shown:
  >gi|12044505|emb|AJ278722.1|AFE278722  Acidithiobacillus ferrooxidans 16S rRNA
          gene (partial), 23S rRNA gene and internal transcribed spacer 1 (ITS1),
           strain K2
           Length=2038

  Score = 3862 bits (1948),  Expect = 0.0
  Identities = 2015/2038 (98%), Gaps = 7/2038 (0%)
  Strand=Plus/Plus

 Query  3317  CGAACGGTAACAGGTCTTCGGATGCTGACGAGTGGCGGACGGGTGAGTAATGCGTAGGAA  3376
              ||||||||||||||||||||||||||||||||||||||||||||||||||||||||||||
 Sbjct  1     CGAACGGTAACAGGTCTTCGGATGCTGACGAGTGGCGGACGGGTGAGTAATGCGTAGGAA  60

 Query  3377  TCTGTCTTTTAGTGGGGGACAACCCAGGGAAACTTGGGCTAATACCGCATGAGCCCTGAG  3436
              ||||||||||||||||||||||||||||||||||||||||||||||||||||||||||||
 Sbjct  61    TCTGTCTTTTAGTGGGGGACAACCCAGGGAAACTTGGGCTAATACCGCATGAGCCCTGAG  120

 Query  3437  GGGGAAAGCGGGGGATCTTCGGACCTCGCGCTAAGAGAGGAGCCTACGTCCGATTAGCTA  3496
              ||||||||||||||||||||||||||||||||||||||||||||||||||||||||||||
 Sbjct  121   GGGGAAAGCGGGGGATCTTCGGACCTCGCGCTAAGAGAGGAGCCTACGTCCGATTAGCTA  180

   [skip some lines]

 Query  5230  ATGGTCAAGTGAATAAGGGCATACGGTGGATGCCTTGGCAGAGACAGGCGATGAAGGACG  5289
              ||||||||||||||||||||||||||||||||||||||||||||||||||| ||||||||
 Sbjct  1921  ATGGTCAAGTGAATAAGGGCATACGGTGGATGCCTTGGCAGAGACAGGCGACGAAGGACG  1980

 Query  5290  TGGATACCTGCGAAAAGCCTCGGGGAGCTGGTAAGCAAGCTTTGATCCGGGGATATCC  5347
              |||||||||||||||||||||||||||||||||| |||||||||||||||||||||||
 Sbjct  1981  TGGATACCTGCGAAAAGCCTCGGGGAGCTGGTAAACAAGCTTTGATCCGGGGATATCC  2038
Note that both sequences are almost identical, which indicates with the coincidence of vertical lines.
Conclude and comment:
2.5 Genome annotation: protein search
- Objective
- Determine proteins within the contigs generated.
- Keywords
- Genes, proteins, alignment.
- Technical elements
- BLAST program, SwissProt database.
- Description of the activity
- Now let’s look for genes that encode proteins. Proteins are chains of molecules, whose links are taken from a set of 20 elements (called amino acids). DNA encodes each amino acid by combining 3 nucleotides. The correspondence between nucleotides and amino acids is called the genetic code and is universal.
It is important to note that the same DNA sequence can be translated into protein in several ways: by taking nucleotides from position (1,2,3), (4,5,6), …, or taking (2,3,4), (5,6,7), …, or (3,4,5), (6,7,8),… In addition, proteins may be encoded in both strands. In short, a DNA sequence can be interpreted in 6 different ways.
In order to simultaneously search for all these combinations, a variant of the BLAST algorithm called blastx, which allows comparing DNA sequences against protein databases.
Reopen the http://www.ncbi.nih.gov/BLAST/ page and choose the mode Translated query vs. protein database (blastx) and the Swiss-Prot data. This database contains a set of protein sequences. In the contigs folder open the file contig2.txt. Select the entire sequence (you can use Control+E) and copy it (Control + C). Then paste it into the text area of the BLAST page (you can use Control+V).
The output of this search is analogous to that described in the previous section. Note that one contig zone is similar to several proteins in one same family, called Cytochrome c oxidase. Go down to the detail of the first alignment. You will see a text similar to the following:
>sp|Q06473|COX1_SYNY3 Cytochrome c oxidase polypeptide I (Cytochrome AA3 subunit 1)
            (Oxidase AA(3) subunit 1)
          Length = 551

 Score =  313 bits (802), Expect = 1e-84
 Identities = 170/457 (37%), Positives = 265/457 (57%), Gaps = 3/457 (0%)
 Frame = -1

Query: 1394 YFRFGPDSKSTAVRYVVLNIVTFFLAGMAAMAIRIELLTPDSTSWWLSEIQYNQTFGIHG 1215
            YF F  D K   ++Y+V + + FF+ G  A A+R EL TP     ++    YNQ   +HG
Sbjct: 20   YFTFCVDHKVIGIQYLVTSFLFFFIGGSFAEAMRTELATPSPD--FVQPEMYNQLMTLHG 77
....
Query: 143  PMFIAGLDGMNRRIAIYLPYLHDINLFMSISSFFLGA 33
            PM   GL GMNRRIA+Y      +N+  +I ++ L A
Sbjct: 437  PMHELGLMGMNRRIALYDVEFQPLNVLSTIGAYVLAA 473
Note that the position of the hypothetical protein (labeled Query) is from 1394 to 33. This means that the protein is in the complementary strand to which we are studying.
Repeat the exercise with contig 2, take note of the proteins there appear and comment.
2.6 Functional annotation: Comparison with known pathways
- Objective
- Infer the presence of a biological mechanism from the previous annotation.
- Keywords
- Metabolic network, operon.
- Technical elements
- Literature.
- Description of the activity
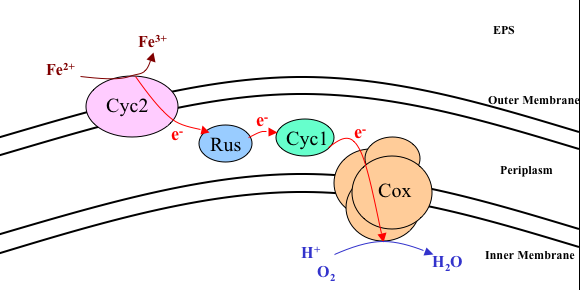
- The literature has described the mechanism for the incorporation of electrons into the inside the cell in species of the type Acidithiobacillus ferrooxidans. The electrons are taken from the ferrous ion, oxidizing it and making it ferric. Some of the proteins found in the exercise of this mechanism.
3 Some conclusions:
It is then expected that in a gene expression experiment, such as the one described in the first activity involving the oxidation of iron, show how the genetic material associated with these contigs shows changes in their levels of expression.
The constant interaction of sequencing and expression experiments complete the functional information and the description of the mechanisms by means of which the bacterium carries out its activity.