Please use this template for your answers
Rabbits

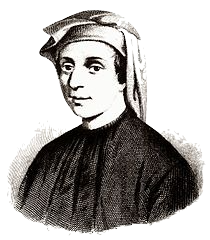
Figure 1. Leonardo Fibonacci, expert on rabbits and numbers.
Near 1170, in the Italian city of Pisa, the son of Guglielmo Bonacci was born. He was named Leonardo. Nowadays, he is known as Leonardo Pisano (meaning “Leonardo of Pisa”) and also as Leonardo Fibonacci (short for “filius Bonacci”, that is, “son of Bonacci”).
Leonardo traveled with his father and, while staying in the city of Béjaïa (Algeria), he was sent to study calculation with an Arab master. He later went to Egypt, Syria, Greece, Sicily, and Provence, where he studied different numerical systems and methods of calculation. He soon realized the many advantages of the Hindu-Arabic system, as introduced first by the famous mathematician Muḥammad ibn Mūsā al-Khwārizmī (born c. 780—died c. 850 in Baghdad).
In 1202, Leonardo wrote the “Book of Calculation” which helped europeans to learn the Hindu–Arabic numerals. In that book he wrote:
A certain man put a pair of rabbits in a place surrounded on all sides by a wall. How many pairs of rabbits can be produced from that pair in a year if it is supposed that every month each pair begets a new pair which from the second month on becomes productive?
He made the following simplifying assumptions about the population:
- The population begins in the first month with a pair of newborn rabbits.
- Rabbits reach reproductive age after one month.
- In any given month, every rabbit of reproductive age mates with another rabbit of reproductive age.
- Exactly one month after two rabbits mate, they produce one male and one female rabbit.
- Rabbits never die or stop reproducing.

Fibonacci’s exercise was to calculate how many pairs of rabbits would remain in one year. We can see that in the second month, the first pair of rabbits reach reproductive age and mate. In the third month, another pair of rabbits is born, and we have two rabbit pairs; our first pair of rabbits mates again. In the fourth month, another pair of rabbits is born to the original pair, while the second pair reach maturity and mate (with three total pairs). After a year, the rabbit population has 144 pairs.
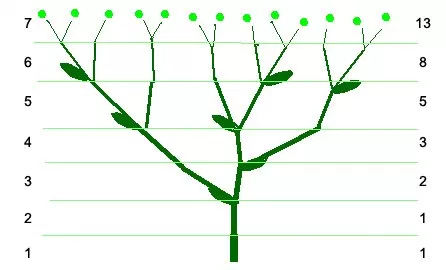
Beyond rabbits, it has been observed that Fibonacci numbers appear often in nature; for example, in the spirals of sunflower heads, in pine cones, in the genealogy of the male bee, in the spiral in snail shells, in the arrangement of leaf buds on a stem, and in animal horns. You can see some of them looking for “Fibonacci in nature” on Google images.
Doing some abstraction, we can use
fib(n) to represent the number of pairs of rabbits on month
n. The numbers have the following rules:
fib(0) = 0fib(1) = 1fib(n) = fib(n-1) + fib(n-2)
1. Write a recursive code
Your task is to write a recursive function in R that has
input n and output fib(n). Remember that
recursive means that the function calls itself, like in the
factorial example.
fib_recursive <- function(n) {
# write your code here
}
You can test your function by checking that at the end of the first year there are 144 pairs of rabbits.
2. Write a non-recursive version
This particular question can also be solved using a loop and without
recursion. In other words, with a code that does not call itself. You
will need to use a for loop, and two variables,
young and old, representing the number of
young and old rabbits.
fib_loop <- function(n) {
# write your code here
}
You can test your function by comparing the results against
fib_recursive (the function of the previous question) for
different values of n.
3. Find the best-fitting line
Now you can collect the values of fib(n) for different
values of n in a vector. Let’s call it y and
let’s take values of n between 1 and 30. You can plot
y versus n and see what kind of line will fit
it.
Please write the code to find the best-fitting line using a suitable
linear model, and find the coefficients. Draw y versus
n and the fitting line.
4. Find the formula
Using the results from the previous question, what is the formula
connecting y and n?
Please use this template for your answers