Let’s say we have written an R script and we want to include some comments about it. For example, we want to discuss the meaning of the results. It is easy to make a report from your R script, with the simple changes we discuss here.
In R, as in several other computer languages, we can insert comments
lines with the symbol #. For example, we can write a file
with extension .R with a script like this
# We simulate some data
data <- data.frame(x=1:10, y=3*1:10+rnorm(n = 10))
# We build a linear model from real data.
# The model connects x and y
model <- lm(y ~ x, data)
model
# now we use the mode to foresee the future.
# The prediction corresponds to x values in newdata
predict(model, newdata=data.frame(x=15:18))
This is a typical script, that produces the expected result and includes comments for documentation.
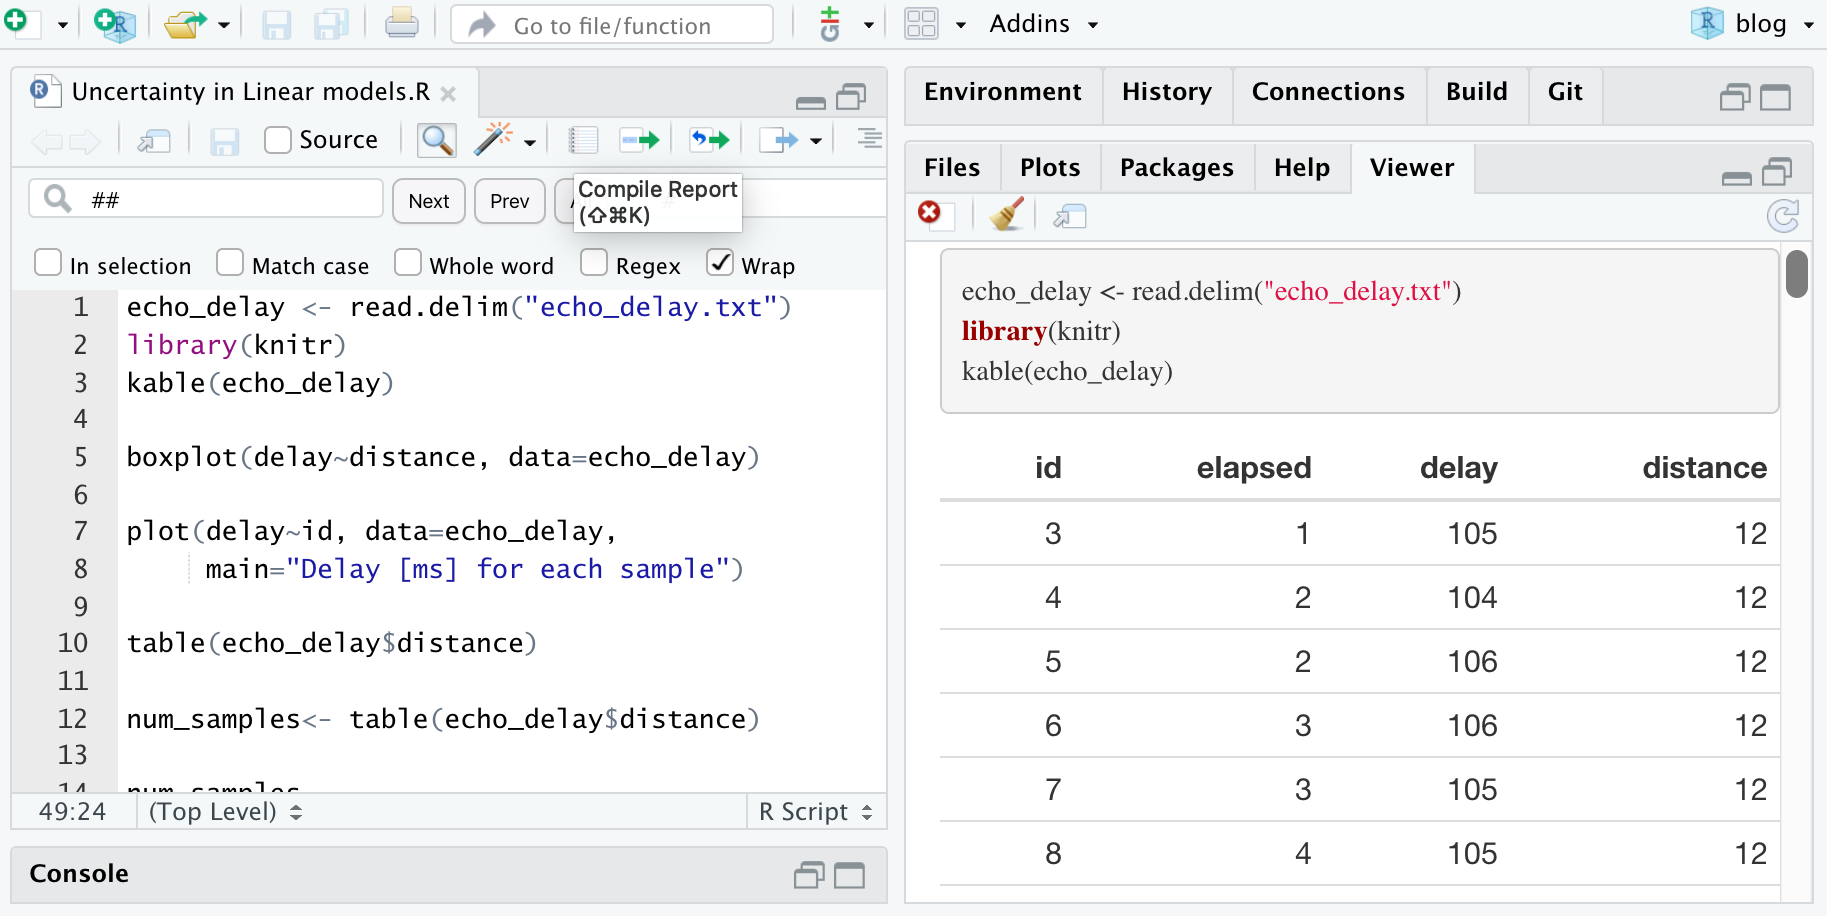
In Rstudio there is a tool to make this report nicer. We can make a document with the code, the comments and the results, just clicking the Compile Report button. In the Mac this can also be done by clicking Cmd-Shift-K. I guess in Windows you can press Ctrl-Shift-K.
Rstudio will offer you the output format. I usually choose HTML, because it is self-contained. It can also be sent to Microsoft Word or PDF, but you need extra software in that case. The code shown above results in a page like this
Untitled.R
anaraven
2020-04-12
# We simulate some data
data <- data.frame(x=1:10, y=3*1:10+rnorm(n = 10))
# We build a linear model from real data.
# The model connects x and y
model <- lm(y ~ x, data)
model
##
## Call:
## lm(formula = y ~ x, data = data)
##
## Coefficients:
## (Intercept) x
## -0.1901 2.9403# now we use the mode to foresee the future.
# The prediction corresponds to x values in newdata
predict(model, newdata=data.frame(x=15:18))## 1 2 3 4
## 43.91424 46.85452 49.79481 52.73510We do not need to share this HTML page, or the Word document. We can share the R file and from it we rebuild all.
Transforming comments to regular text
There is a style of writing reports of programs that combines regular text and code. This is called “Literate Programing”, and it allows us to describe what the program should do and what results we got in plain English, or any other human language.
In this case it is easy to convert the comments into regular text. We
just need to use #' instead of #. This way we
get one part for the human and one part for the computer. For the
program, comments are still comments, but the HTML output is nicer. See
the following example
#' We simulate some data
data <- data.frame(x=1:10, y=3*1:10+rnorm(n = 10))
#' We build a linear model from real data.
#' The model connects x and y
model <- lm(y ~ x, data)
model
#' now we use the mode to foresee the future.
#' The prediction corresponds to x values in newdata
predict(model, newdata=data.frame(x=15:18))
The previous code —only changing # to #'—
produces an output like this
Untitled.R
anaraven
2020-04-12
We simulate some data
data <- data.frame(x=1:10, y=3*1:10+rnorm(n = 10))We build a linear model from real data. The model connects x and y
model <- lm(y ~ x, data)
model
##
## Call:
## lm(formula = y ~ x, data = data)
##
## Coefficients:
## (Intercept) x
## 0.8509 2.9038now we use the mode to foresee the future. The prediction corresponds to x values in newdata
predict(model, newdata=data.frame(x=15:18))## 1 2 3 4
## 44.40726 47.31102 50.21477 53.11853Marking code in text
It is a good idea to use some convention to indicate what is English
and what is code inside the regular text. For example we want to show
that x is a variable. The HTML page should show it with a
different font, typically a monospaced font such as Courier.
It is easy to mark code inline. We just surround it with backticks
(`). For example, we write `x` and
`newdata`.
We can also easily mark text to be italic or boldface by surrounding
text with single or double asterisks (*). For example, if we write
*italics* we get italics, and if we write
**boldface** we get boldface. It should be
used not too often, and never as a title or
heading.
In fact we can use a wide set of markup to indicate the structure of the document. The rules are a semi-standard called Markdown, widely used in several applications including Python and GitHub. You can find more details online, or just using Google.
One important thing to keep in mind is to use the proper markdown for document structure. Do not use boldface for titles, since boldface has no meaning. If you are writing a complete line on boldface, then you probably want to say something else.
To indicate that a line is a section title, start the line with
#'#.
#' We simulate some data
data <- data.frame(x=1:10, y=3*1:10+rnorm(n = 10))
#' We build a **linear model** from real data.
#' The model connects `x` and `y`
model <- lm(y ~ x, data)
model
#' now we use the *model* to foresee the future.
#' The prediction corresponds to `x` values in `newdata`
predict(model, newdata=data.frame(x=15:18))
Now the result looks like this
Untitled.R
anaraven
2020-04-12
We simulate some data
data <- data.frame(x=1:10, y=3*1:10+rnorm(n = 10))
We build a linear model from real data. The model
connects x and y
model <- lm(y ~ x, data)
model
##
## Call:
## lm(formula = y ~ x, data = data)
##
## Coefficients:
## (Intercept) x
## -0.8045 3.1458
now we use the model to foresee the future. The prediction
corresponds to x values in newdata
predict(model, newdata=data.frame(x=15:18))## 1 2 3 4
## 46.38232 49.52811 52.67391 55.81970More details
Official documentation: Compile Report from R script
Another example, from a biologist: Using R Studio’s “Compile Report” Command