Please download the file homework-6.R and write your results there
1. The town is full of rats
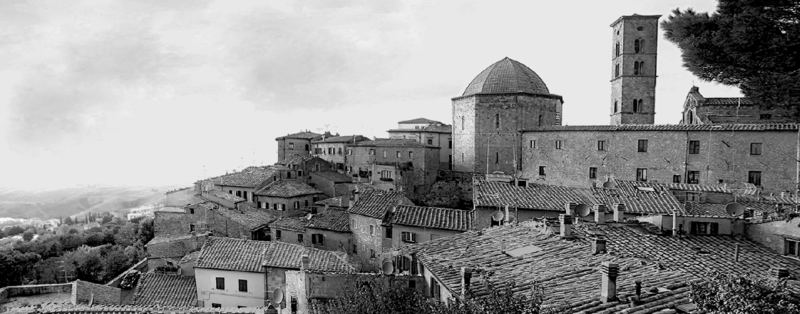
The Italian town of Volterra has a big problem with rats. There are
rats all around the town, running day and night, and eating all the
cheese. The major of the city, Don Vito, 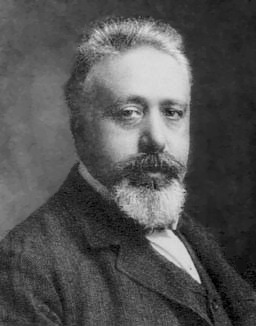
Don Vito, Major of Volterra. got some cats to deal with the
problem. At first, it apparently worked, but after a few years the rats
came back again and again. Every time the people think that the cats
have eaten all the rats, they return and everybody complains to the
major.
To understand why this happens, Don Vito has hired you as an expert
on data analysis. You will work with Dr. Alfred J. Lotka, 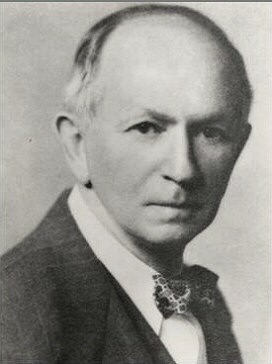
Dr. Lotka, expert on cats and rats. who will provide you with the
data.
Dr. Lotka has calculated that, if there are no cats, every
day the rat population increases by a birth_rate equal
to 1.3%.
The rats cross through the city all day and night, running away from
the cats. These cats can only survive and reproduce by catching rats.
If a cat catches a rat, the rat dies and a new cat is
born. Naturally, the number of rats captured (and cats born)
depends on the rat population size, the cat population size, and on how
good are the cats on catching rats, which we call
catch_rate. Dr. Lotka thinks that catch_rate
is one in one million. Rats are really scared and are running at all
times. If you don’t run, you die, they say in rat
tradition.
These cats are hunters. They do not eat cat food, only rats.
The cats are also running all day and night, because if they do not
catch a rat, they starve and die. Dr. Lotka has measured that the
death_rate, is equal 0.7% every day. If you don’t run,
you die, they say in cat tradition.
On the first day of the study there are 3000 rats and 100 cats. With the data available, the Major asks you: Will the cats eat all the rats?
To figure out we will build a computational model. The “cat and rat” system can be represented by this diagram:

Your mission is to write a function called cat_and_rat
to simulate the cat and rat population for many days. The inputs of this
function must be:
N, the number of days that we will simulate,birth_rate, the birth rate for rats,catch_rate, the death rate of rats and birth rate of cats,death_rate, the death rate of cats,rats_ini, the initial number of rats, andcats_ini, the initial number of cats.
All inputs are mandatory. The output of the function must be a data
frame with two columns: cats and rats.
# write your answer hereIf everything is right, you can test your function with the following code that show the history of cats and rats for the next ten years:
town <- cat_and_rat(N=3650, rats_ini=3000, cats_ini=100, birth_rate=1.3/100,
                    catch_rate=1e-6, death_rate=0.7/100)
plot(town$cats, xlab="Days", ylab="Population", type="l")
lines(town$rats, lty=2)
legend("top", legend=c("cats","rats"), lty = 1:2, inset=c(0,-0.2), horiz = TRUE, xpd = TRUE)
We can see that at the beginning the cats catch many rats, eating almost all of them. Then everybody is happy and think that cats win and the problem is finished. But then there are so few rats that cats begin to starve and die. After near two years there are so few cats that the rats population start growing and the town is full of rodents again. So the Major can see that cats will not solve the problem.
How does behavior change when conditions change?
In the output of cat_and_rat() we can find the minimum
size of the rat population, given the rates and initial values. It is
natural to ask how small will be the rat population if rates or
initial values change. For example, you can plot
min(town$rats) versus catch_rate, or depending
on cats_ini.
Please create a vector named initial_cats, with the
sequence of numbers between 10 and 500 increasing by 10. Then calculate,
for each value in initial_cats, what is the minimum number
of rats in the simulation when cats_ini is a value in
initial_cats. Store each result in the vector
min_rats and plot it.
# write your answer here
Bonus
In general, you can study the effect of each rate and initial value on the rat population with different measurements, for example:
min(town$rats)max(town$rats)sum(town$rats)locate_half(town$rats)(as defined in homework 5)
# write your answer hereWe can also see the relationship between cats and rats in the state space diagram. The state of the system is the value of all parts of the system. In this plot we can see what happens in the house in general, independent of the day.
plot(rats ~ cats, data=town)
We can see that, contrary to intuition, getting more cats does not reduce the minimum number of cats. On the contrary, more cats result in more surviving rats.
2. When the cat is away, the rats will play
Dr. Lotka thinks that these rats have some kind of genetic resistance to the cats, so we should analyze the rat genome. He wants to see if there is any atypical gene in the chromosome 20 of rat’s genome that can be useful in his research. Your mission is to identify which genes are different from the others.
Please go to the NCBI webpage of Rattus norvegicus chromosome 20, and download the Coding Sequences in FASTA format and store it on your disk. You should click on the “Send to” link and choose the appropriate options, as in the following picture
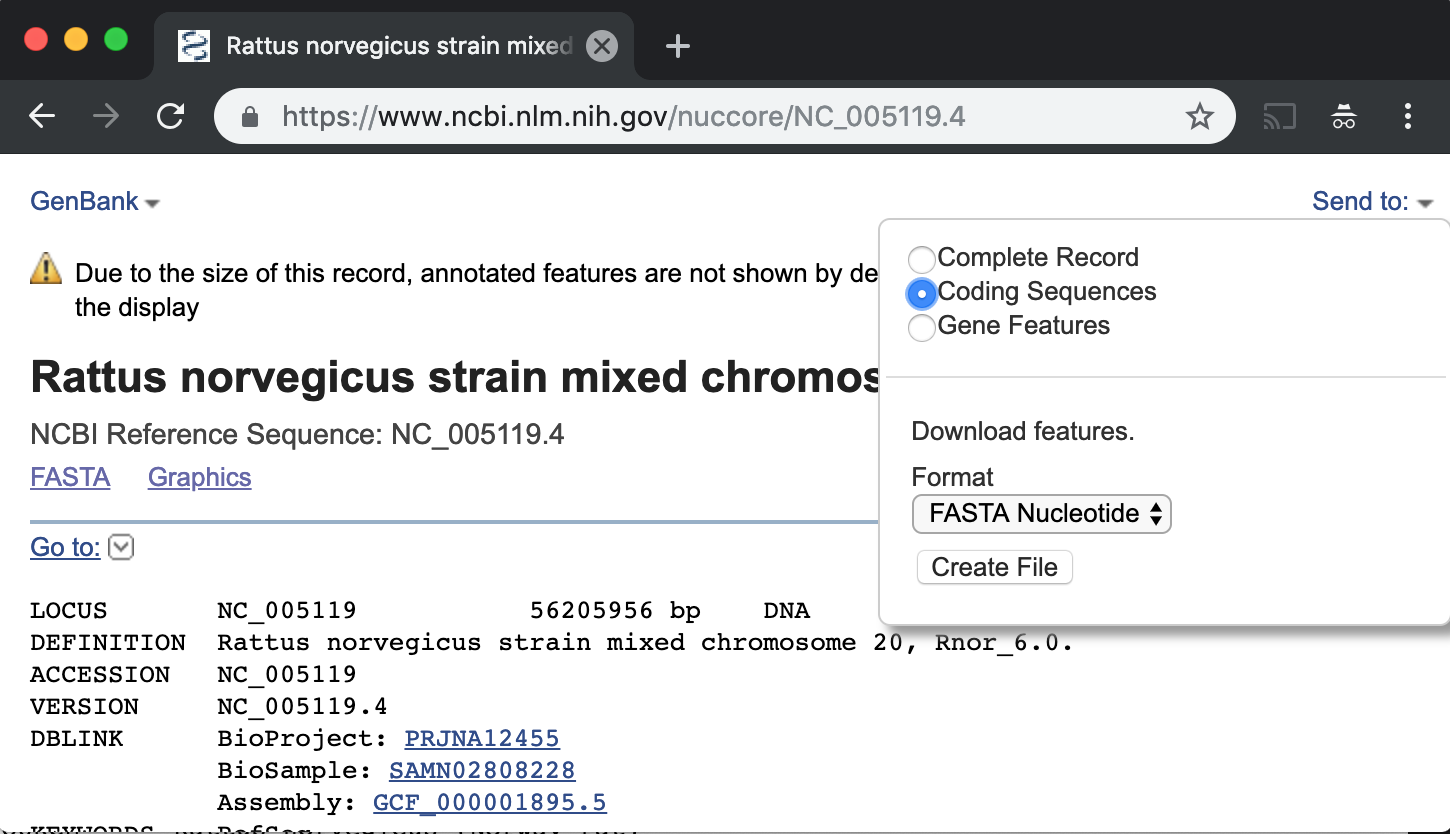
This will give you a file named sequence.txt. The file
is a FASTA file, even if the filename extension is .txt.
Write the code to load the FASTA file into an R list called
genes using the function read.fasta() from the
seqinr library. Then find how many genes are in the
chromosome. The result should be:
# write your answer here[1] 1508Calculate GC content
Now you have to calculate the GC content This is not the GC-skew we saw in class. The GC
content is \[\frac{G+C}{A+C+G+T}.\] of each
gene. Fortunately the seqinr library provides a function called
GC() that takes a single DNA sequence and returns the GC
content. Please write the code to calculate the GC content of each gene
and store it on the vector gc_genes.
# write your answer hereIf everything is right you should be able to plot the following figure:
plot(gc_genes)
abline(h=mean(gc_genes))
Find extreme values
Most of the genes have similar GC content. We want to know which gene
has the highest GC content and which one as the lowest. Please write the
code to find each one of these genes. First, find the index of maximum
and of minimum in the gc_genes vector.
# write your answer here[1] 770
[1] 29Then use these indices to look inside names(genes)
# write your answer here[1] "lcl|NC_005119.4_cds_XP_017457325.1_770"
[1] "lcl|NC_005119.4_cds_XP_017457319.1_29"Remember that the list genes was created with the
function read.fasta(). It is a named list, and the
name of each element is the NCBI accession of each gene.
Bonus
In the plot we can see that most of genes are below average in the first part of the chromosome, then above average, then below again. That is, there are three regions in the chromosome. Can you find the limits of these regions? In other words, can you find which genes are in the border of each region and draw this plot?
# write your answer here
3. A turtle draws a cat
All this cat and rat issue has been bad for tourism. To revert this situation Don Vito, the Major of the city, wants to make an art exposition to show how computers can handle cats and rats. He asks you to write a program to draw a rat like the one in the figure, using Turtle graphics.

Remember that you can move the turtle without drawing using the
command turtle_setpos(x,y), and you can choose any angle
using turtle_setangle(angle). For your convenience, you can
also use the following functions turtle_polygon(N,D) and
turtle_circle(D) defined here:
turtle_polygon <- function(N, D) {
    side <- D * sinpi(1/N)
    turtle_do({
        turtle_left(90-180/N)
        for(x in 1:N) {
            turtle_forward(side)
            turtle_right(360/N)
        }
    })
}

turtle_circle <- function(D) {
    turtle_polygon(180, D)
}
In both functions the parameter D indicates the
diameter of the polygon or circle. When you use
turtle_polygon() the parameter N indicates the
number of sides on the polygon. For example
turtle_polygon(3) draws a triangle. The center of the
polygon is always in the direction where the turtle was looking.
The rat’s body has diameter 36, the head’s diameter is 20 and the ears have diameter 10. The eyes have diameter 4 and the nose size is 2.5.
# write your answer hereBonus
Write also the code to draw the cat.
# write your answer hereColophon
This story is fictional but the analysis is real. If you want to know the real story, ask Google about “Lotka Volterra”.
Remember: The more exercises you do, the more chances you have to pass the course.