The more stuff in it, the busier the work of art, the worse it is. More is less. Less is more. The eye is a menace to clear sight. The laying bare of oneself is obscene. Art begins with the getting rid of nature.
Ad Reinhardt, Abstract Expressionist artist
In the course “Systems Biology” I gave some papers to the students and asked them to make a presentation based on them. The instruction was:
Your presentations should have at least 3 parts
- What is the question that the authors want to answer? What is the problem they want to solve?
- What is the proposed solution? How did they answer the question? Maybe show an example
- How good is the solution? What are the quality indices? How to evaluate them?
The following two cases are some of the answers delivered by the students. I will use them as examples of how to simplify your slides.
Case 1
The next two slides were prepared by one of the students of the “Systems Biology” course. They are a summary of the paper by Batista et al. 2002. The first slide introduces the question, the second suggest a way to answer it.
As you can see the titles of the slides are literally my instructions. That was not the idea. The slides should be for the public, not for the professor. How can we simplify them?
What is the object under study? It is not very clear. It can be
- “Can we obtain detailed knowledge”, i.e. do we have a good method to observe a phenomenon
- The microbial community
- The “community structure” and the “functional relationship”
- The seasonal change in these things
- Our capability to modify these things
All theses approaches are valid in different contexts. The question about “us” are questions about technology. The questions about “nature” are scientific questions.
I will simplify focusing on the microbial community and how it changes with seasons. I found a catchy phrase to motivate.
Winter is coming. What will the microbial community do?
Now we have to simplify the text. I did simplify step-by-step as follows
- Can we obtain a detailed knowledge of microbial community structure and functional relationship for driving these system toward desired outcomes?
- Can we understand the microbial community structure and functional relationship for driving these system toward desired outcomes?
- Can we understand the microbial community structure and functional relationship and control them to get desired outcomes?
- There is a microbial community. Can we see its structure? Can we see the functional relationships? Can we control them?
- There is a microbial community. How can we see its structure? How can we see the functional relationships? How can we control them?
Question 4 is shorter that question 5 but the answers are less interesting. If we ask “Can we control them?” the answer may be “no” and we are done. Not interesting. Instead asking “How can we control them?” forces us to solve the problem.
Finally I added the idea that the structure and functional relationships change through seasons, and got this slide:
Now we have to do the same for the next slide. I start with a provisional title “Samples”. The text is too long. We change it like this
- A comparative integrated omic analysis including metagenomics, metatranscriptomics and metaproteomics was carried out to elucidate functional differences between seasonally distinct oleaginous mixed microbial communities (OMMCs) sampled from an anoxic BWWT (biological wastewater treatment) tank.
- The authors study oleaginous mixed microbial communities (OMMCs) sampled from an anoxic BWWT (biological wastewater treatment) tank. The authors carried out a comparative integrated omic analysis including metagenomics, metatranscriptomics and metaproteomics to find functional differences between seasonally distinct communities.
- Subject: oleaginous mixed microbial communities sampled from an anoxic biological wastewater treatment tank. They change with the seasons. Comparative analysis integrated “omics”: metagenomics, metatranscriptomics and metaproteomics to find functional differences.
I got a slide like the following. With more effort can be even simpler.
Case 2
Here it is harder to understand, because most of the content was (or should have been) in the previous slides. The main ideas that we have to know a priori are:
- We are looking for genes that change their expression (i.e. misregulate) in tumor cells
- These genes will be used as diagnostic markers. If some combination of them misregulate, then the sample is tumor
- This combination of genes is called separator
- Moreover, we want to have a small separator. Better to have 10 markers than 1000 markers, no?
In that context we have this slide:
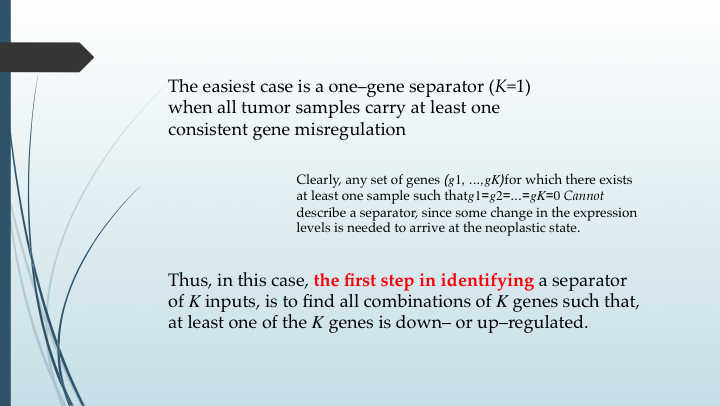
There are three boxes, each one with a sentence that we want to simplify. The first box can be changed like this:
- The easiest case is a one–gene separator (K=1) when all tumor samples carry at least one consistent gene misregulation
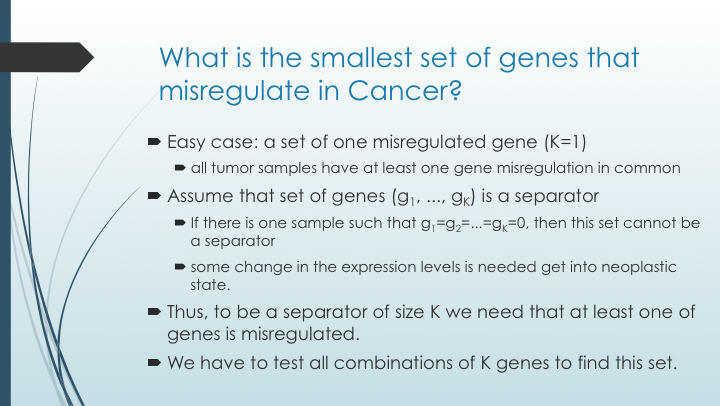
- Easy case: one-gene separator (K=1). All tumor samples carry at least one consistent gene misregulation
- Easy case: a set of one mis-regulated gene (K=1). All tumor samples carry at least one mis-regulated gene in common
Second box:
- Clearly, any set of genes \((g_1, ...,g_K)\) for which there exists at least one sample such that\(g_1=g_2=...=g_K=0\) Cannot describe a separator, since some change in the expression levels is needed to arrive at the neoplastic state.
- Any set of genes \((g_1, ...,g_K)\) for which there exists a sample such that \(g_1=g_2=...=g_K=0\) cannot describe a separator, since some change in the expression levels is needed to arrive at the neoplastic state.
Third box
- Thus, in this case, the first step in identifying a separator of K inputs, is to find all combinations of K genes such that, at least one of the K genes is down– or up–regulated.
- Thus, the first step in identifying a separator of size K is to find all combinations of K genes such that, at least one of the K genes is mis-regulated.
- Thus, in a separator of size K, at least one of the K genes is mis-regulated. To find it, we have to search all combinations of K genes.
- Thus, to be separator of size K we need that at least one of the genes is mis-regulated. We have to test all combinations of K genes to find this set.
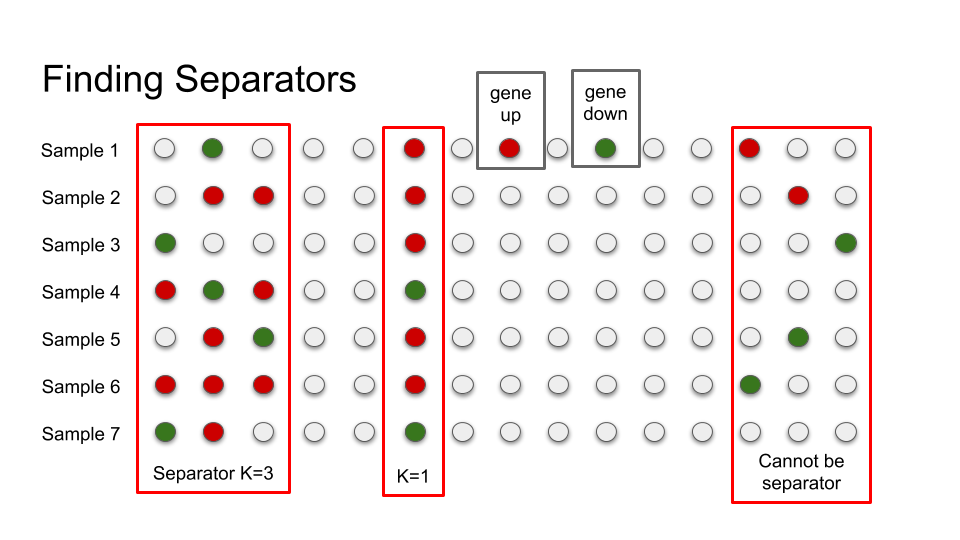
Finally, as people know since a long time, an image worths a thousand words and we can draw something like this:
Additional material
While preparing this examples I found some additional material that can be useful:
- English Communication for Scientists is an interesting online book published by Nature. There is a chapter about “Giving Oral Presentations”, and all the book is relevant to us,
- Scientific presentations: A cheat sheet, a post in NatureJobs blog,
- When it Comes to Presentations – Less is More, as we said 😉.
References
Batista, Daniela, Ana Polycarpa Carvalho, Rafaela Costa, Ricardo Coutinho, Sergey Dobretsov, Willy Verstraete, Mette Burmølle, et al. “Comparative Integrated Omics: Identification of Key Functionalities in Microbial Community-Wide Metabolic Networks.” Npj Biofilms and Microbiomes 57, no. 6 (2002): 10–13. doi:10.1038/npjbio.