Epilepsy affects 1% of the World population. Thus, the probability
for one person is c(Yes=0.01, No=0.99). We can simulate
n persons with the following code:
epilepsy <- function(n) {
    return(
        sample(c("Yes","No"),
            size=n,
            replace = TRUE,
            prob = c(0.01, 0.99)
        )
    )
}
We are 97 people in the course, including me. To simulate a group like us we use
epilepsy(97)## [1] "No" "No" "No" "No" "Yes" "No" "No" "No" "No" "No" "No"
## [12] "No" "No" "No" "No" "No" "No" "No" "No" "No" "No" "No"
## [23] "No" "No" "No" "No" "No" "No" "No" "No" "No" "No" "No"
## [34] "No" "No" "No" "No" "No" "No" "No" "No" "No" "No" "No"
## [45] "No" "No" "Yes" "No" "No" "No" "No" "No" "No" "No" "No"
## [56] "No" "No" "No" "No" "No" "No" "No" "No" "No" "No" "No"
## [67] "No" "No" "No" "No" "No" "No" "No" "No" "No" "No" "No"
## [78] "No" "No" "No" "No" "No" "No" "No" "No" "No" "No" "No"
## [89] "No" "No" "No" "No" "No" "No" "No" "No" "No"We replicate the experiment to get 1000 samples of size 97
courses <- replicate(1000, epilepsy(97))
dim(courses)
## [1] 97 1000Here courses is a matrix, not a data
frame. We have to use [row, col], not
[[column]].
We got a lot of data, but very little information. We did not learn anything from the 97000 words. We want numbers, not words. We need a function that
- takes one column of
courses, and - gives us an integer with the number of “Yes”
This is your mission. Write the code to produce a vector named
cases of size 1000, with the number of “Yes” in each
column. If everything goes right you will get something similar
to this:
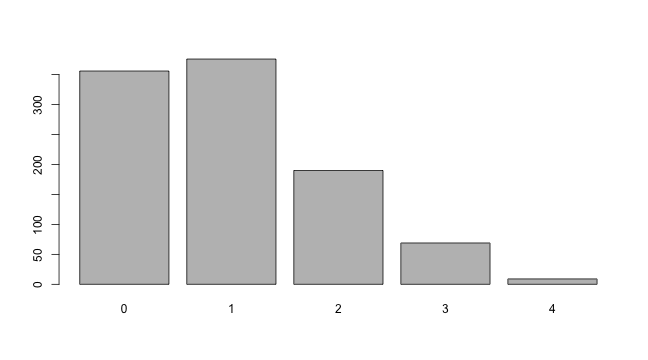
table(cases)## cases
## 0 1 2 3 4
## 356 376 190 69 9barplot(table(cases))